
The Calculator: Fossil Fuel Consumption, CO2 Emissions, and Costs with Wind (Part I)


[Editor note: Kent Hawkins has been at the forefront of devising a model to estimate the lost wind-related emission reductions due to the fact that backup fossil-fuel generation (to firm wind) must operate less efficiently. This two-part series (today and tomorrow) provides Mr. Hawkins' latest thinking. While technical, the Calculator is a very important line of analysis that will continue to be revised by its open-minded author. So critical comments are especially welcome.]
The Calculator is a tool to assist in understanding some of the realities of integrating wind into electricity systems. It shows results for fossil fuel consumption, CO2 emissions, and associated costs, based on a range of input factors.
This update is based on feedback from the Calculator series and comparisons with studies involving some level of actual results by Bentek and le Pair and de Groot. (A copy of the Calculator can be obtained here). There are no changes to the approach taken, but improvements have been made, including a better user-interface. Note that input should be entered only in cells that are outlined or by using the provided sliders. Other cells contain calculated amounts or references.
Critics have charged that the Calculator is not based on any production data to support the results reported in the Calculator series. But, this misses the point. Considering that there is not sufficient, appropriate data available publically to permit a comprehensive analysis, the calculator expresses a working hypothesis based on the important factors that bear on wind integration:
- Impact of wind volatility on fossil fuel plants required to balance wind production
- The need to introduce fast-reacting but less efficient gas plants into the generation portfolio
- Focus on the effects of the intertwined nature of wind plants and fossil fuel plants versus macro analyses, for example, at the country or state level
- Seasonality of wind production
- Consideration of the likelihood that some fossil fuel plants in the wind-balancing role may be able to operate “normally”, for example in periods of low wind production, including no wind conditions.
So the Calculator does not “prove” that wind plants increase CO2 emissions but shows the impact of a number of considerations. To illustrate this, it can be used to show what is often claimed by wind proponents. To do this, set the parameters so that there is (1) no efficiency loss in balancing fossil fuel plant and hence no increased fossil fuel consumption and CO2 emissions per MWh, (2) no change in capacity factor of the wind-balancing fossil fuel plants, and (3) there is no need to introduce more fast-reacting but less efficient gas plants (known variously as OCGT, SCGT and CT) into the plant portfolio.
The point is that the Calculator should:
- Cause users to think about the many factors involved in the integration of poor performing, unreliable and intermittent wind plants when doing their own analyses or reviewing others.
- Be seen as a way of quickly seeing the effects of varying these factors. It saves a lot of calculations, and provides a means of testing the sensitivity of each.
In other words, the Calculator is a framework within which to think about these considerations. As an example that is transferable from every day experience, does your car use less gas per mile driving at a relatively steady speed on the highway compared to the stop/start, speed-up/slow-down overall slower speeds of city driving? This can be applied to the effect on gas plants balancing wind’s intermittent behaviour, versus their running on a relatively steady basis as they were intended. See Part II for a discussion of newer gas plant types.
The latest version also calculates the cost per tonne of CO2 emissions saved or increased, depending upon input parameters. The first is the cost of CO2 mitigation and the second is, in effect, the cost of actually subsidizing CO2 emissions when wind plants cause their increase.
Heat Rate Penalty
An important part of the Calculator is the relationship between the reduced efficiency of the wind-balancing fossil fuel plants as a result of having to mirror wind’s random, intermittent variability (involving the full range of wind capacity) and the amount of fossil fuel consumed and CO2 emissions produced as a result.
The first issue that must be addressed is the heat rate penalty experienced over time (the Calculator assumes a year) by the fossil fuel plants in the wind-balancing role. This is not an instantaneous value, which might be observed at a point in time. It should also not be interpreted as a heat rate penalty due to continuous, “normal” operation at a reduced efficiency level. Nominally, I choose a heat rate penalty of 20%, which is intended to incorporate all the considerations. The Calculator provides for a range of 0-30% which should be adequate.
If you are satisfied that this is a reasonable heat rate penalty, but less satisfied that this should apply to all plants operating in the wind balancing role you can alter the heat rate penalty by a factor of 0-100%, which is in effect representing the amount of time that a heat rate penalty applies. Examples, requiring this would be: (1) a wind regime where the wind production rarely if ever reaches 100%, and (2) the case when wind production is zero to very small for relatively lengthy periods of time. Zero percent means there is no heat rate penalty and 100% means that the selected heat rate penalty value is used unaltered. Within gas plants, likely only the CCGT plant heat rate should be adjusted in this way. The use of two factors is a bit redundant, but it serves to make the two considerations explicit.
Figure 1 shows the effect on CO2 emissions for the case of CCGT alone in a wind balancing role (the question of the feasibility of this is not addressed) and also with the introduction of OCGT, for a range of heat rate penalties for CCGT from 0 to 20% (the x-axis). The heat rate penalty for OCGT is set at 20%. The ratio of CCGT:OCGT for low and high wind periods used is 70:30 and 30:70 respectively.
Figure 1 – Using only CCGT plants for wind balancing, there are CO2 emissions savings. Once OCGT plants are introduced into the wind-balancing mix, CO2 emissions savings become negative, that is, emissions are increased. At the CCGT:OCGT mix used, even at no heat rate penalty for CCGT plants, emissions are still slightly increased by about 100 tonnes per year.
The introduction of OCGT (alternatively CCGT operating as OCGT) has a dramatic effect. It is arguably necessary to provide the capability to respond to wind’s volatility, but is almost always overlooked in analyses of wind and CO2 emissions.
The cost per tonne of CO2 emissions for these conditions is shown below in Figures 2 and 3.
Required Fossil Fuel Plant Capacity
The Calculator does not show the capacity of the fossil fuel plants that are dedicated to wind balancing, and assumes the fossil fuel plant capacity for this purpose is available. In a specific case if it is not available, then additional plants must be built, but this does not affect the calculator results. It is a capacity planning matter. It should be noted that capacity in excess of requirements without wind must be available for wind balancing. Germany provides evidence of this here and here at slide 13. For a capacity planning purposes, capacity credit shows a statistical value over time to meet some level electricity system reliability. Capacity Credit values for electricity system reliability less than 99% should be suspect.
In determining CO2 emission costs per MWh of wind production, the full levelized costs of the wind balancing fossil fuel plants are used, whether it is new build or existing.
Cost of CO2 Emissions Mitigation/Subsidization
For details see the Costs tab in the Calculator. Note that there is an adjustment parameter for fossil fuel plant capacity factor, which is left there so the effect of varying it can be more easily seen. Unless the user wants to vary this, care should be taken that this is set at 100%. For ease of reference, the value set is shown in the User Interface.
The levelized costs used are those found in the DOE EIA’s Annual Energy Outlook 2010. Note that capital costs component have been subsequently adjusted upwards by the DOE EIA here, which shows increases in capital costs (overnight) of 21% for onshore wind, 49% for offshore wind, 25% for coal, 39% for OCGT and -3% for CCGT.
If the presence of wind reduces CO2 emissions the costs are mitigation costs. If wind increases CO2 emissions then the costs are actually subsidizing this unintended consequence.
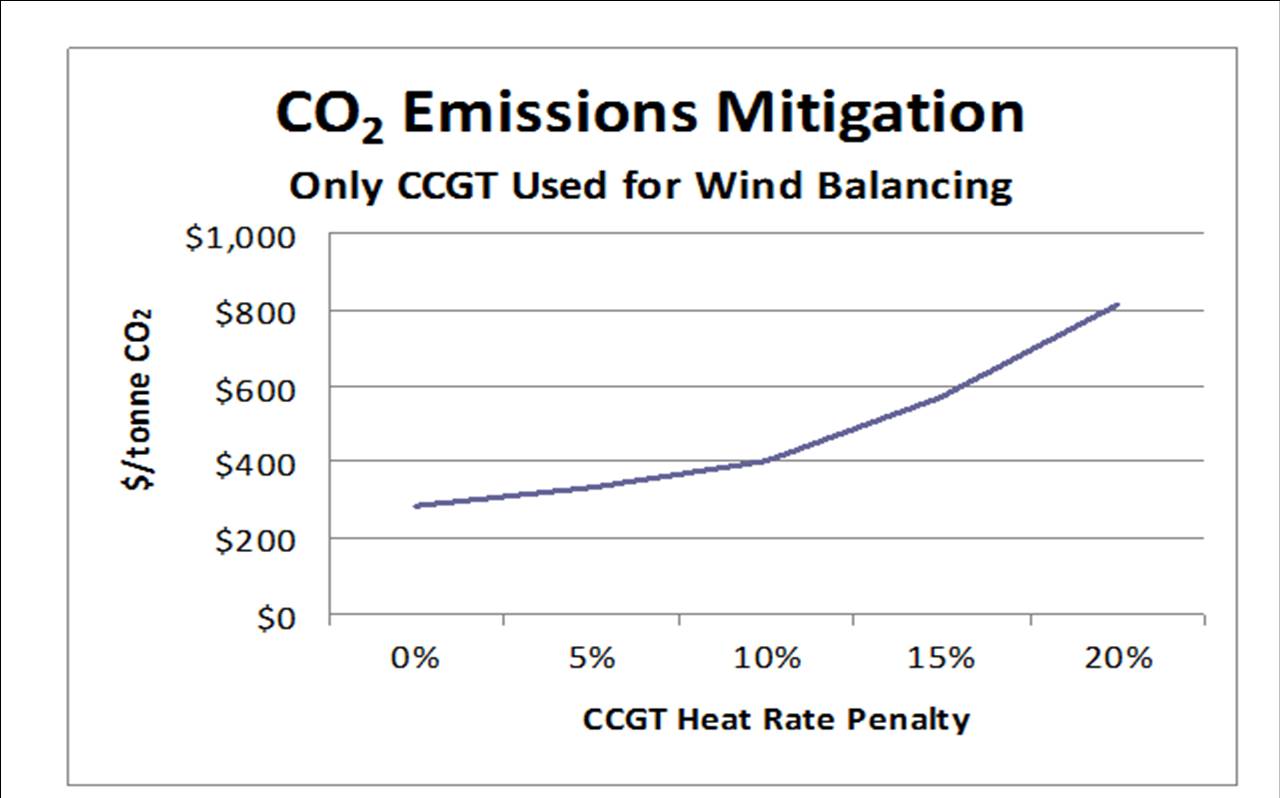
Figures 2 shows the Calculator results for CCGT heat rate penalties from 0-20%.
Figure 2 – Costs of mitigating CO2 emissions with wind assuming CCGT alone is used for wind balancing. A heat rate penalty of 0% is a typical condition for CO2 emissions savings used by wind proponents and produces savings of 2.6 million tonnes of CO2 per year. At this point, the Calculator shows a cost of $284/tonne CO2.
The cost per tonne increases with increased CCGT heat rate penalty because the CO2 emissions savings decrease and the costs increase slightly due to increased variable Operations and Maintenance (O&M) costs for the CCGT plants. Remember the heat rate penalty shown is an annual average, not an instantaneous value, which will be higher.
As an aside, and explaining some CO2 mitigation costs that may be claimed, if coal plant production is assumed to be displaced by wind acting alone, and without any heat rate penalty for the wind-balancing coal plants, the costs are $100 per tonne CO2.
In any event all these costs are multiples of those experienced in emissions trading markets in Europe and the US.
When OCGT plants are added to the mix, emissions savings can become negative. The associated costs become a subsidization of the production of CO2 emissions with values as shown in Figure 3.
Figure 3 – Realistically OCGT plants will be needed to balance wind’s continuous volatility. Assuming a CCGT:OCGT mix for low and high wind periods to be 70:30 and 30:70 respectively shows substantially higher costs than assuming CCGT alone, due to the lower efficiency of OCGT gas plants. The costs at 0% CCGT heat rate penalty are the highest because CO2 emissions savings have just turned into a small increase of 100 tonnes per year. The subsidization cost rate decreases as the CO2 emissions increase due to emissions increasing faster than costs.
Although subsidization costs decrease with increased CCGT heat rate penalty, these costs remain very high. In summary, the Calculator shows that jurisdictions with such conditions are paying substantially in terms of actually subsidizing the creation of CO2 emissions. In your country state or province, look for the implementation of OCGT (also known as SCGT or CT) plants. As an alternative, but less discernable situation, especially with small wind penetration, the operation of CCGT plants in OCGT mode may be occurring.
Part II describes the Calculator in more detail, and provides information to assist in countering wind proponent claims.
Notwithstanding the limitations of the Calculator, any realistic choice of input parameters for it shows that the pursuit of policies providing incentives for the implementation of utility-scale wind plants is a futile solution for reducing the use of fossil fuels and CO2 emissions. The required expenditure of the large amount of national wealth, in the order of many hundreds of billions of dollars, is folly. Further exacerbating the financial aspects is the inherent potential equity euphoria and securitization of such programs. This, plus the diversion of human resources in government and industry otherwise needed to provide effective solutions for present and future electricity needs, will be seen as a critical lost opportunity to the detriment of future generations in all countries.
Source:
Anyone can join.
Anyone can contribute.
Anyone can become informed about their world.
"United We Stand" Click Here To Create Your Personal Citizen Journalist Account Today, Be Sure To Invite Your Friends.
Please Help Support BeforeitsNews by trying our Natural Health Products below!
Order by Phone at 888-809-8385 or online at https://mitocopper.com M - F 9am to 5pm EST
Order by Phone at 866-388-7003 or online at https://www.herbanomic.com M - F 9am to 5pm EST
Order by Phone at 866-388-7003 or online at https://www.herbanomics.com M - F 9am to 5pm EST
Humic & Fulvic Trace Minerals Complex - Nature's most important supplement! Vivid Dreams again!
HNEX HydroNano EXtracellular Water - Improve immune system health and reduce inflammation.
Ultimate Clinical Potency Curcumin - Natural pain relief, reduce inflammation and so much more.
MitoCopper - Bioavailable Copper destroys pathogens and gives you more energy. (See Blood Video)
Oxy Powder - Natural Colon Cleanser! Cleans out toxic buildup with oxygen!
Nascent Iodine - Promotes detoxification, mental focus and thyroid health.
Smart Meter Cover - Reduces Smart Meter radiation by 96%! (See Video).


| Online: | |
| Visits: | 1,599,604,682 |
| Stories: | 8,139,637 |
Whistler Blowers, Insiders
