
A Cherry-Picker’s Guide to Temperature Trends Update: Warming Crisis Not


Back in October 2009, my post “A Cherry-Picker’s Guide to Temperature Trends” examined the many different statements that could be made to describe the tendencies of global temperatures over the past 20 years. I concluded that anything from rapid cooling to a faster than expected warming could be supported by carefully picking through the available data.
Now, more than a year later, and after one of the “warmest years on record,” I’ve updated my analysis so that any new statements coming out characterizing global temperature can be evaluated against the complete set of recent observations.
In general, I find that statements such as “global warming has stopped” should be tempered, at least for the time being. But, I conclude that my summary (from my original article), remains applicable:
What I can say for certain, is that the recent behavior of global temperatures demonstrates that global warming is occurring at a much slower rate than that projected by the ensemble of climate models, and that global warming is most definitely not accelerating.
I say “more or less” because one could argue from the data (as we’ll see below) that the warming rate during recent years has upticked with the warmth in 2010 indicating a warming that is occurring faster than projected and is accelerating. But, I think that this represents a temporary condition.
In due course (say over the next several months), the warmth in 2010 will continue to subside as the cooling influence from a Pacific La Niña event supplants the warming influence of last year’s El Niño (see here for example). This will have the effect of flattening out recent temperature trends and returning them once again to lower-than-projected values. I imagine that we’ll see such an impact when it comes time again for me to produce an update to this update.
But until that time, I’ll describe the situation as it presents itself data available through December 2010.
The Story through 2010
Much of the following text is repeated from my original article, updated where required.
Accusations of cherry-picking—that is, carefully choosing data to support a particular point—are constantly being hurled around by all sides of the climate change debate. Commonly, accusations of cherry-picking are levied at analyses describing the recent behavior of global average temperature. Primarily, because claims about what the temperature record says run the gamut from accelerating warming to rapid cooling and everything in between—depending on who you ask and what point they are trying to make
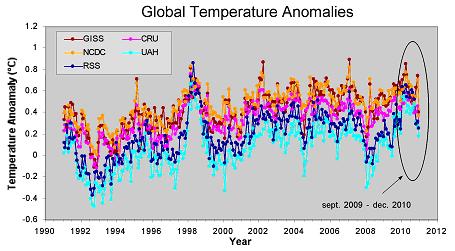
Figure 1 illustrates the various cherry varieties that you have to choose from when trying to fashion your own interpretation of the recent behavior of global temperatures. It shows the global temperature history during the past 20 years as compiled in five different datasets (three representing surface temperatures, and two representing the temperatures in the lower atmosphere as measured by satellites—the latter being relatively immune from the data handling issues which plague the surface records).
Figure 1. Global temperature anomalies from January 1991 through December 2010 as contained in five different data compilations. The GISS (Goddard Institute for Space Studies), NCDC (National Climate Data Center), and CRU (Climate Research Unit) data are all compiled from surface records, while the RSS (Remote Sensing Systems) and UAH (University of Alabama-Huntsville) data are compiled from satellite observations of the lower atmosphere. The circled portion is the new data added since my original article.
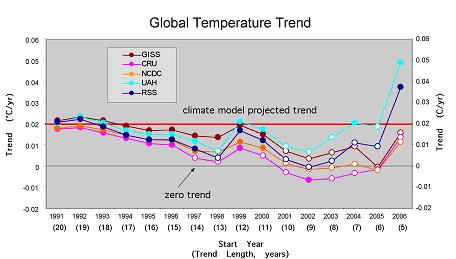
To give you some guidance as to which cherries to use to make which ever point you want, I have constructed a Cherry-Pickers Guide to Global Temperatures (Figure 2).
Figure 2. Cherry-Pickers Guide to Global Temperatures. Each point on the chart represents the trend beginning in September of the year indicated along the x-axis and ending in December 2010. The trends which are statistically significant (p
It shows the current value (though December 2010) of trends of various lengths from all of the five commonly used global temperature compilations. I compute the trends as simple linear least squares fits through the monthly global average temperature anomalies for each dataset (from Figure 1). Each point on the Figure 2 (for each dataset) represents the trend value for a different length period, beginning in January of the year indicated along the horizontal axis and ending in December 2010. Starting in January of particular year and ending in December of last year produces a trend with a length expressed in units of whole years. For example, a trend starting in January 1999 and ending in December 2010 include 120 months, or 10 complete years. The values for the 10-yr trend for each dataset are plotted on the chart directly above the value on the horizontal axis labeled 1999. If the trend value is statistically significant at the 1 in 20 level (p
I also include several other items of potential interest to the cherry harvesters; first is the dotted horizontal line representing a trend of zero—i.e., no change in global temperature, and second, the thick red horizontal lines which generally indicates the average trend projected to be occurring by the ensemble of climate models. Bear in mind that red line only represents the average model expectation, not the range of model variability. So it shouldn’t be used to rule out whether or not a particular observed value is consistent with model expectations, but does give you some guidance as to just how far from the average model expectation the current trend lies (a cherry picker is not usually worried about the finer details of the former, but, instead, the coarser picture presented by the latter).
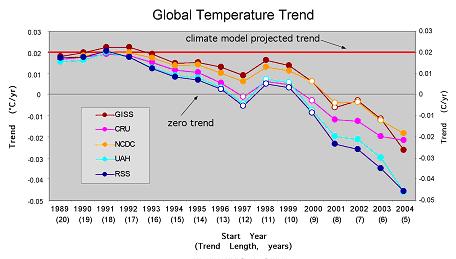
For comparison to my original analysis, I include the figure below (Figure3) which is what the trends (in Figure 2) looked like with data ending in August 2010.
Figure 3. Same as Figure 2, except with data beginning in September of the year indicated along the x-axis and ending in August 2009.
Notice that in general, the trends ending in December 2010 (in Figure 2) are more positive (or less negative) for all trend lengths, with the biggest changes occurring for the shorter length trends. Instead of indicating rapid cooling, most trends shorter than 9 years in length currently indicate some degree of warming taking place. There is much less support currently for the notion that “global warming has stopped” than there was 16 months ago (although there are signs that support for such a statement is building again—note the general decline in temperatures during the last 6 months or so in Figure 1).
Now and Then
Here is a comparison of some general statements I made in October 2009 verses how the situation presents itself today.
Old Statement: For the past 8 years (96 months), no global warming is indicated by any of the five datasets.
New Statement: During the past 9 years most datasets indicate some degree of global warming taking place. The data from the Hadley Center is perhaps an exception to this general statement (although the Hadley Center dataset may include a cooling bias).
Old Statement: For the past 5 years (60 months), there is a statistically significant global cooling in all datasets.
New Statement: For the past 5 years (60 months), there is statistically significant global warming in the two satellite datasets, the surface datasets indicate a non-significant warming trend.
Old Statement: For the past 15 years, global warming has been occurring at a rate that is below the average climate model expected warming.
New Statement: For most of the past 17 years, global warming has been occurring at a rate that is below the average climate model expected warming.
The last statement—which is the same now as it was then, is arguably the most important. Despite a record (or near record, depending on who you ask) high for global temperatures in 2010, the general rate of warming over the past decade and half (going on two decades) is generally less than it was expected to be.
This bodes well for the earth’s environment and its denizens from polar bears to human beings.
Let’s hope that it continues (and there are plenty of reasons why it may).
Be sure to stay tuned for further updates!
Source:
Anyone can join.
Anyone can contribute.
Anyone can become informed about their world.
"United We Stand" Click Here To Create Your Personal Citizen Journalist Account Today, Be Sure To Invite Your Friends.
Please Help Support BeforeitsNews by trying our Natural Health Products below!
Order by Phone at 888-809-8385 or online at https://mitocopper.com M - F 9am to 5pm EST
Order by Phone at 866-388-7003 or online at https://www.herbanomic.com M - F 9am to 5pm EST
Order by Phone at 866-388-7003 or online at https://www.herbanomics.com M - F 9am to 5pm EST
Humic & Fulvic Trace Minerals Complex - Nature's most important supplement! Vivid Dreams again!
HNEX HydroNano EXtracellular Water - Improve immune system health and reduce inflammation.
Ultimate Clinical Potency Curcumin - Natural pain relief, reduce inflammation and so much more.
MitoCopper - Bioavailable Copper destroys pathogens and gives you more energy. (See Blood Video)
Oxy Powder - Natural Colon Cleanser! Cleans out toxic buildup with oxygen!
Nascent Iodine - Promotes detoxification, mental focus and thyroid health.
Smart Meter Cover - Reduces Smart Meter radiation by 96%! (See Video).


| Online: | |
| Visits: | 1,605,392,501 |
| Stories: | 8,136,899 |
Whistler Blowers, Insiders
