The conventional academic corporate bond puzzle has been that ‘risky’ bonds generate too high a return premium (see
here).
The most conspicuous credit metric captures US BBB and AAA bond yields going back to 1919 (Moody’s calls them Baa and Aaa). This generates enough data to make it
the corporate spread measure, especially when looking at correlations with business cycles.
Yet BBB bonds are still ‘investment grade’ (BBB, A, AA, and AAA), and have only a
25 basis point expected loss rate (default x loss in event of default). 10-year cumulative default rate after the initial rating.
Since the spread between Baa and Aaa bonds has averaged about 1.0% since 1919, this generates an approximate 0.75% annualized excess return compared to the riskless Aaa yield. Given the modest amount of risk in BBB portfolios, this creates the puzzle that corporate bond spreads are ‘too high.’
HY bonds have grades of B and BB (CCC bonds are considered distressed). Their yields have averaged 3.5% higher than AAA bonds since 1996, yet the implication on returns is less obvious because the default rates are much higher (3-5% annually over the cycle). As a defaulted bond has an average recovery rate of 50% of face, a single default can wipe out many years of a 3.5% premium.
Prior to the 1980s all HY bonds were ‘fallen angels,’ originally investment grade but downgraded due to poor financial performance. Mike Milken popularized the market to facilitate corporate take-overs, and by the 1990s it became common for firms to issue bonds in the B or BB category. In the early 1990s there was a spirited debate as to the actual default rate, and total returns, on HY bonds. This was not merely because we did not have much data on default and recovery rates, but also because bonds issued as HY instead of falling to HY might be fundamentally different. Indeed, when I worked at Moody’s in the late 1990′s I came across an internal report, circa 1990, that guestimated the default rate for HY bonds would be around 15% annualized. HY bonds were not just risky, but there was a great deal of ‘uncertainty’ in the sense of Knight or Keynes (winning a lottery vs. the probability Ivanka Trump becomes president).
We now have 32 years of data on this asset class, and as usual, the risky assets have lower returns than their safe counterparts. There is a HY
yield premium, but no
return premium.
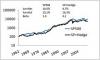
The primary data we have are the Bank of America (formerly Merrill Lynch) bond indices, which go back to December 1988. Here we see a seemingly intuitive increase in risk and return:
Annualized Returns to US Corp Bond Indices
Bank of America (formerly Merrill Lynch)
December 1988 to March 2020
|
|
BBB
|
AA
|
|
AnnRet
|
7.85%
|
7.18%
|
6.49%
|
|
AnnStdev
|
8.17%
|
5.42%
|
4.58%
|
These indices are misleading. Just as using end-of-day prices to generate a daily trading strategy is biased, monthly price data for these relatively illiquid assets inflate the feasible return. Managers in this space pay large bid-ask spreads, and if they are seen eager to exit a position–which is usually chunky–this generates price impact, moving the price. Add to this the operational expense incurred in warehousing such assets, and we can understand why actual HY ETFs have lagged the Merrill HY index by about 1.4%, annualized
High Yield ETF Return Differential to BoA High Yield Index
|
2008 – 2020
|
2007 – 2020
|
|
JNK v. BoA
|
HYG vs. BoA
|
|
-1.58%
|
-1.28%
|
JNK and HYG are US tickers, BoA is their High Yield Total Return Index
With this adjustment, the HY return premium in the BoA HY index disappears relative to Investment Grade bonds. In my 2008 book
Finding Alpha I documented that over the 1997-2008 period, closed-end bond funds showed a 2.7% return premium to IG
over HY bonds. More recently, we can look at the difference in the HY and IG bond ETFs since then:
US Corporate ETF Return Differential to Investment Grade
|
2008 – 2020
|
2007 – 2020
|
|
JNK vs. LQD
|
HYG vs. LQD
|
|
-0.86%
|
-0.97%
|
LQD is the ticker for a US investment grade ETF
Over 12 years, holding a far riskier junk bond portfolio generated 1% less in annualized returns. While the BoA HY indices are biased, this bias tends to affect the mean, not the variance, of HY bond returns. Thus, abstracting from the illusory higher mean return, we can see HY bonds are riskier in any intuitive sense over time: they are more volatile and underperform most during bear markets.
The HY anomaly is just another facet of the ‘low vol’ investing insight. The advantage of low vol assets within any asset class is not so much that they have superior returns–it’s a slight advantage–but that they avoid pointless risk. People are naturally drawn to investments with huge upsides like lottery tickets for many reasons (see
here), and this preference dominates the cold rational analysis that implies you would buy such assets only if you were offered a premium.
The bottom line is the corporate bond risk premium is an illusion: the Moody’s Baa-Aaa spread does not generalize to HY bonds. Over the cycle, greedy investors looking at yields discover yields are different than returns and there is no risk-karma fairy making sure you get paid for taking on more risk. Aristotle provides a better investing foundation than the CAPM and its spawn: moderation in all things, and have humility about your ability to out-forecast the market.