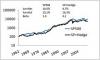
Dates of US Bear Markets Since 1873


It’s useful to test longer-term rules, such as trend-following, across many cycles. To this end, it is useful to have dates for bull and bear markets. If your sample is merely from, say, 2010-2019, you will have 2520 data points, but no bear markets. Thus, you can prove such a strategy works by noting the significance level of your statistics, but anyone with some knowledge of history would see the error. A strategy optimized over only bull markets is, as they say, ‘problematic.’ The US stock market has been in bear markets 20% of the time since 1871.
I have identified 24 US bear markets since 1873. I’d like to say it is a purely objective classification, but there are some judgment calls. Basically, I looked for the traditional “20% drawdown” definition. Several bear markets did not actually meet this standard–1990, 1957, 1873–but I included them anyway out of respect for history. For example, the ‘Panic of 1873′ occurred in the midst of European turmoil, started when the US and many other nations demonetized silver, was the first wave of railroad failures, had many bank failures, and even caused a 10-day closure of the New York Stock Exchange. The recession from 1873-77 was the longest in US history.
On the other hand, prices were falling from 1871 through 1907, and so the 21% decline in the 1883 bear market was only down 2% in real term. Yet, the period is often called a ‘depression as opposed to a recession, and it is often called the ‘panic of 1874.’ As the US just returned to the gold standard in 1879, many Europeans were skeptical the US could maintain it and were selling their US assets. Many businesses and banks failed. To say this was not a bear market because in real terms the markets were virtually flat seems wrong.
I used Shiller’s data for data prior to 1926, and Ken French’s data for afterward. Shiller’s data is monthly, and this tends to soften cycles, avoiding the true peaks and troughs. Shiller’s data is a little funky, as for example, for this year his February return is flat while the SP500 was down 8%. These discrepancies tend to leak over to other months, however, so for measuring bull and bear market returns they are probably less problematic. Further, prior to 1926, I don’t have anything better.
While not perfect, it’s useful to have these dates, at least for a starting point. If you have suggestions on amendments, I would appreciate them. You can download this here.
| Start | End | Decline | Prior Rise | Months | Comments |
|---|---|---|---|---|---|
| Feb-1873 | Nov-1873 | -18% | #N/A | 10 | Left silver, failure of Jay Cooke, railroads, Europe weak |
| Mar-1876 | Jun-1877 | -33% | 32% | 16 | End of longest recession |
| Sep-1882 | Jan-1885 | -21% | 198% | 29 | Foreign run on US assets due to worry about US gold standard |
| Jan-1893 | Aug-1893 | -25% | 89% | 8 | Failure of railroads, banks |
| Sep-1895 | Aug-1896 | -19% | 34% | 12 | Double dip from last recession |
| Sep-1902 | Oct-1903 | -26% | 194% | 14 | Minor recession |
| Oct-1906 | Nov-1907 | -32% | 76% | 14 | A run on Knickerbocker Trust , JPMorgan leads bailout |
| Nov-1916 | Dec-1917 | -28% | 160% | 26 | Start of inflation, US entered WW1 |
| Oct-1919 | Aug-1921 | -23% | 60% | 23 | Prices fall by 50% after rising 100% in war |
| 9/7/29 | 2/27/33 | -84% | 635% | 43 | Great Depression |
| 3/6/37 | 3/31/38 | -51% | 416% | 14 | Short-lived massive retained earnings tax |
| 10/25/39 | 4/28/42 | -31% | 68% | 31 | Start of WW2 |
| 5/29/46 | 6/6/47 | -24% | 237% | 13 | End of war transition |
| 8/2/56 | 10/22/57 | -17% | 421% | 16 | Minor recession |
| 12/12/61 | 6/26/62 | -28% | 122% | 7 | Kennedy micro-manages steel price increases |
| 2/9/66 | 10/7/66 | -21% | 101% | 9 | Fed tightens, relents |
| 11/29/68 | 5/26/70 | -37% | 71% | 19 | Collapse of merger wave, tech boom |
| 1/11/73 | 10/3/74 | -48% | 88% | 22 | OPEC oil crisis |
| 11/28/80 | 8/12/82 | -20% | 246% | 21 | Peak inflation, Volker Fed tightening |
| 8/25/87 | 12/4/87 | -33% | 281% | 4 | Fed tightens to support dollar, market crash |
| 1/2/90 | 10/11/90 | -18% | 71% | 10 | Run-up to Iraq War I, junk bond & Comm RE bust |
| 3/24/00 | 10/9/02 | -50% | 575% | 31 | Collapse of tech bubble/911 attack |
| 10/9/07 | 3/9/09 | -55% | 131% | 18 | Mortgage crisis |
| 2/19/20 | 3/12/20 | -27% | 535% | 2 | Covid |
Source: http://falkenblog.blogspot.com/2020/12/dates-of-us-bear-markets-since-1873.html
Anyone can join.
Anyone can contribute.
Anyone can become informed about their world.
"United We Stand" Click Here To Create Your Personal Citizen Journalist Account Today, Be Sure To Invite Your Friends.
Please Help Support BeforeitsNews by trying our Natural Health Products below!
Order by Phone at 888-809-8385 or online at https://mitocopper.com M - F 9am to 5pm EST
Order by Phone at 866-388-7003 or online at https://www.herbanomic.com M - F 9am to 5pm EST
Order by Phone at 866-388-7003 or online at https://www.herbanomics.com M - F 9am to 5pm EST
Humic & Fulvic Trace Minerals Complex - Nature's most important supplement! Vivid Dreams again!
HNEX HydroNano EXtracellular Water - Improve immune system health and reduce inflammation.
Ultimate Clinical Potency Curcumin - Natural pain relief, reduce inflammation and so much more.
MitoCopper - Bioavailable Copper destroys pathogens and gives you more energy. (See Blood Video)
Oxy Powder - Natural Colon Cleanser! Cleans out toxic buildup with oxygen!
Nascent Iodine - Promotes detoxification, mental focus and thyroid health.
Smart Meter Cover - Reduces Smart Meter radiation by 96%! (See Video).


| Online: | |
| Visits: | 1,602,708,220 |
| Stories: | 8,147,656 |
Whistler Blowers, Insiders
