A Simple Equity Volatility Estimator


Given the conditional volatility varies significantly over time it is very useful to generate a VIX proxy for cases where one does not have VIX prices. This includes pre-1986 US, countries that do not have VIX indices, and when trying to estimate the end-of-day VIX. This latter problem is subtle but important because historical closing VIX prices are taken from the 4:15 ET in the US while the market closes at 4:00, and so using VIX prices for daily strategies can generate a subtle bias when used in daily trading strategies.
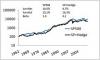
One can see that the old VIX index was significantly more biased upwards than after these changes. This implies abnormal volatility trading strategies prior to 2004 if you assumed the VIX was a true par variance swap price. Now, there should be a slight positive bias in the VIX due to the variance premium, where shorting variance generates a positive return over time. Personally, I think this variance premium is really a consequence of the equity premium, in that short variance strategies have very strong correlations with being long the market. That is, the variance premium is not an independent priced risk factor, just a consequence of the equity premium given its high beta.
|
VIX
|
Var(VIX)
|
Actual Vol
|
Actual Variance
|
|
|
1986-2003
|
20.91
|
4.96
|
17.67
|
3.12
|
|
2004-2019
|
18.20
|
4.05
|
17.99
|
3.24
|
|
VIX/ActVol
|
Var(VIX)/ActVar
|
|||
|
1986-2003
|
1.18
|
1.59
|
||
|
2004-2019
|
1.01
|
1.25
|
As a liquid market price, the VIX is a good benchmark for any equity volatility model. The most common academic way to estimate volatility is some variant of a Garch(1,1) model, which is like an ARMA model of variance:
The problem is that you need to estimate the parameters {w, α, β} using a maximum likelihood function, which is non-trivial in spreadsheets. Further, there is little intuition as to what these parameters should be. We know that α plus β should be less than 1, and that the unconditional variance is w/(1-α-β). That still leaves the model highly sensitive to slight deviations, in that if you misestimate them you often get absurd extrapolations.
Alas, this has two problems. First, there is a predictable bias in the EWMA because it ignores mean reversion in volatility. Garch models address this via the intercept term, but as mentioned it is tricky to estimate and creates non-intuitive and highly sensitive parameters. We can see this bias by sorting the data by VIX into deciles, and take the average EWMA, where the relative difference in the VIX and the EWMA increases the lower the EWMA. As this bias is fairly linear, we can correct for this via the function
| VIX | EWMA | EWMA* | |
| Low | 11.1 | 8.1 | 10.6 |
| 2 | 12.7 | 10.2 | 13.2 |
| 3 | 14.0 | 11.4 | 14.7 |
| 4 | 15.6 | 12.4 | 15.8 |
| 5 | 17.1 | 13.4 | 16.9 |
| 6 | 18.7 | 15.0 | 18.7 |
| 7 | 20.7 | 17.3 | 21.2 |
| 8 | 23.0 | 19.1 | 23.1 |
| 9 | 25.9 | 21.3 | 25.3 |
| High | 40.3 | 39.5 | 39.7 |
There are a couple of good reasons for this asymmetric volatility response to price changes. As recessions imply systematic economic problems, there’s always a chance that negative news is not just a disappointment, but reveals a flaw in your deepest assumptions (e.g., did you know you don’t need 20% down to buy a house anymore?). This does not happen in commodities because for many of these markets higher prices are correlated with bad news, such as oil shocks or inflation increases. Another problem is that many large-cap companies are built primarily of exponential growth assumptions. Companies like Tesla and Amazon need sustained abnormal growth rates to justify their valuations, so any decline could mean an inflection point back to normal growth, lowering their value by 90%. Again, this has no relevance for commodities.
|
VIX
|
EricVol
|
EWMA
|
|
|
Low
|
11.1
|
10.8
|
8.1
|
|
2
|
12.7
|
13.6
|
10.2
|
|
3
|
14.0
|
15.0
|
11.4
|
|
4
|
15.6
|
16.1
|
12.4
|
|
5
|
17.1
|
17.2
|
13.4
|
|
6
|
18.7
|
19.2
|
15.0
|
|
7
|
20.7
|
21.9
|
17.3
|
|
8
|
23.0
|
24.0
|
19.1
|
|
9
|
25.9
|
26.7
|
21.3
|
|
High
|
40.3
|
43.2
|
39.5
|
|
EWMA
|
EricVol
|
|
|
2008
|
29%
|
82%
|
|
Oct-08
|
-19%
|
84%
|
|
total
|
37%
|
75%
|
|
VIX
|
EWMA |
EricVol
|
|
|
day-ahead
|
33.0%
|
26.9%
|
34.3%
|
|
Month-ahead
|
61.1%
|
58.4%
|
61.8%
|
If we look at regressions that predict future variance given our estimates, we see EricVol is significantly better than a simple EWMA. While it does slightly better than the VIX, I doubt this generates significant profits trading, say, the VXX, though readers are free to try.
Source: http://falkenblog.blogspot.com/2020/02/simple-vol-estimators.html
Anyone can join.
Anyone can contribute.
Anyone can become informed about their world.
"United We Stand" Click Here To Create Your Personal Citizen Journalist Account Today, Be Sure To Invite Your Friends.
Please Help Support BeforeitsNews by trying our Natural Health Products below!
Order by Phone at 888-809-8385 or online at https://mitocopper.com M - F 9am to 5pm EST
Order by Phone at 866-388-7003 or online at https://www.herbanomic.com M - F 9am to 5pm EST
Order by Phone at 866-388-7003 or online at https://www.herbanomics.com M - F 9am to 5pm EST
Humic & Fulvic Trace Minerals Complex - Nature's most important supplement! Vivid Dreams again!
HNEX HydroNano EXtracellular Water - Improve immune system health and reduce inflammation.
Ultimate Clinical Potency Curcumin - Natural pain relief, reduce inflammation and so much more.
MitoCopper - Bioavailable Copper destroys pathogens and gives you more energy. (See Blood Video)
Oxy Powder - Natural Colon Cleanser! Cleans out toxic buildup with oxygen!
Nascent Iodine - Promotes detoxification, mental focus and thyroid health.
Smart Meter Cover - Reduces Smart Meter radiation by 96%! (See Video).


| Online: | |
| Visits: | 1,602,708,220 |
| Stories: | 8,147,656 |
Whistler Blowers, Insiders
