
Global Lukewarming: A Great Intellectual Year in 2011


“This begins to start to make you wonder whether there is some fundamental problem between climate models and reality.”
“Lukewarmers” are those scientists (and others) who believe the balance of evidence is middling between “climate alarmists” (who tend to think that the global temperature rise will lie in, or even exceed, the upper half the IPCC’s 1.1°C–6.4°C range of projected temperature rise this century) and ultraskeptics, or “flatliners” (who tend to think that the addition of human-generated carbon dioxide has virtually no impact on global temperatures).
Lukewarmers have found the world to be a lonely place. But favor (think physical processes of global climate) smiled for us in 2011. Several scientific studies produced results, when considered in combination, provide evidence that the general warming of the earth’s climate is proceeding at a rate the lies in the lower half of the IPCC’s projected temperature change during the 21st century.
And with a low-end temperature rise comes along low end impacts. Seemingly good news for all!
2011 Temperatures
First, let’s review the global average temperature, both at the surface, and in the lower atmosphere since 1979—the year that satellite observations of the temperature from the lower atmosphere become reliably available, and pretty near the beginning of the second warming episode of the 20th century. Fig. 1 shows the temperature data from one surface dataset (from the U.S. National Oceanographic and Atmospheric Administration) and one satellite dataset of observations from the lower atmosphere (from the University of Alabama in Huntsville). There are other data compilations besides these two, but they are somewhat similar and the differences are not what I am interested in discussing here (although it is by no means an uninteresting topic).
Figure 1. Annual average global temperature anomalies from the surface (red) and from the lower atmosphere (blue), 1979-2011 (the value for 2011 in the surface record is based on only 11 months of data).
It is pretty obvious that the global temperature in 2011 have done little to hasten the observed temperature increase, but rather has acted to further ensconce the established trend (if not add a tiny bit of downward pressure on it). As the trend in global temperature rise continues to be rather low, the amount of scientific scrutiny it is subject to grows, for it pushes at the envelope of our understanding of climate change and variability under rapidly increasing anthropogenic greenhouse gas emissions.
Observed Trend Less Than Climate Model Simulations
A prominent paper examining the issue was published in 2011 by Dr. Benjamin Santer and a long list of colleagues including some of the bigger names in climate science. These researchers set out to see just how unusual the rather low warming rate in the lower atmosphere is when compared with climate model expectations of the evolution of the temperatures when run with a combination of the observed (through the year ~2000) and projected (through 2010: from the IPCC’s SRES A1B scenario) anthropogenic enhancements to the atmosphere’s chemical and physical composition.
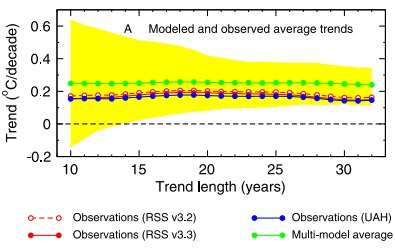
What the researchers found was that the observed temperature trends calculated from periods ranging from 10 to 32 years all lie below the average trend of the same length projected by a large family of climate models (Fig. 2). Each climate model includes some representation of some of the processes which lead to “natural” (random) variability (processes such as El Niño/La Niña, volcanic eruptions, solar variability—note that not all models include all of these processes throughout the entire 1979-2010 period of study). As the time period over which the temperature trend is calculated increases, the impacts of natural variability on the magnitude (and even the sign) of the trend decreases as the short-term temperature deviations caused by random variability tend to cancel out. Therefore, the envelope of model expected trends shrinks as the period of time over which the trend is determined expands (yellow area in Fig. 2). What this means is that the observed trends (in Fig. 2) begin to become much more unusual compared with model expectations as the trend lengthens. By the time you get to trend lengths of 30 or so years, the observed trend is threatening the lower limit of the 95% confidence range of climate model expectations. This begins to start to make you wonder whether there is some fundamental problem between climate models and reality.
Figure 2. A comparison between modeled and observed trends in the average temperature of the lower atmosphere, for periods ranging from 10 to 32 years (during the period 1979 through 2010). The yellow is the 5-95 percentile range of individual model projections, the green is the model average, the red and blue are the average of the observations, as compiled by Remote Sensing Systems and University of Alabama in Huntsville respectively (adapted from Santer et al., 2011).
Over the full record (1979-2010) the real world has only warmed about two-thirds as much as models indicate that it should have. If this continues to the end of the century, the IPCC’s 21st century warming range of 1.1°C to 6.4°C becomes about 0.75°C to 4.25°C —with a central value of 2.5°C. But what’s worse is that a model/observation disparity could indicate that the climate models are not faithfully reproducing reality, which would mean that they are not particularly valuable as predictive tools.
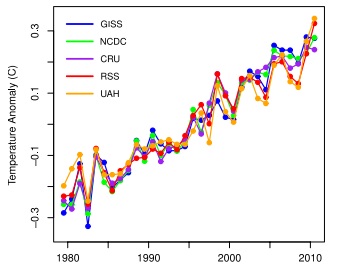
My conclusion (which, is different from that of the authors) based upon the research presented by Santer et al.—that the models are on the verge of failing—is further strengthen by the results of another paper published in 2011 by Foster and Rahmstorf. These researchers sought to identify the magnitude of the natural signals present in the observed trends of surface and lower atmospheric temperatures and to see whether the recent slowdown in the rate of global average temperature rise could be explained by the combination of the timing of natural influences (again, solar, El Niño/La Niña, volcanoes). Ultimately, they concluded that, if fact, it could be. And when the natural signals were removed from the global temperature record, global warming was alive and well and proceeding at a remarkable steady rate since the beginning of their period of study, 1979-2010 (Fig. 3). According to the authors “[t]here is no indication of any slowdown or acceleration of global warming, beyond the variability induced by these known natural factors.”
Figure 3. Global temperatures (from various compilations of the surface (GISS, NCDC, CRU) and the lower atmosphere (RSS, UAH)) after the natural signals have been removed, 1979-2010 (from Foster and Rahmstorf, 2011).
What makes the Foster and Rahmstorf work particularly encouraging for lukewarmers is that the authors find that for periods of 30 years or so, the removal of natural variability makes little difference on the magnitude of the observed trend in the lower atmosphere. However, thinking back upon the results from Santer et al., the same is probably is not entirely true for all of the climate model runs for the 1979-2010 time period. Almost certainly, the combination of random variability has added some amount of noise to the trend distribution even at time frames of 30 years or so. What this means, is that if the modeled temperatures were also stripped of their natural variability, then the 95% range of uncertainty (the yellow area depicted in Fig. 2) would contract inwards towards the model mean (green line). The net effect of which would be to make the observed trends (red and blue lines in Fig. 2) over the past 30 years or so lie even closer to (if not completely outside of) the lower bound of the 95% confidence range from the model simulations. Such a result further weakens our confidence in the models and further strengthens our confidence that future warming may well proceed at a modest rate, somewhat similar to that characteristic of the last three decades.
Climate Sensitivity
Another popular lukewarmer paper in 2011 was published by a research team led by Andreas Schmittner from Oregon State University and concerned an estimate of the earth’s climate sensitivity (and the uncertainty about that estimate) derived from some recently published determinations of land and sea surface temperatures during the Last Ice Age based on a collection of climate proxies. Schmittner and colleagues found that when using these newly available proxies from both land and ocean areas, not only was their central estimate of climate sensitivity (how much the earth’s temperature will change with a doubling of the atmospheric concentration of carbon dioxide) a bit lower than the IPCC central estimate, but more importantly, Schmittner et al.’s determination of the uncertainty about their estimate virtually rules out climate sensitivities above 6°C. This finding is in stark contrast to the IPCC entertaining the possibility of a “fat right-hand tail” to the distribution of potential values including climate sensitivity values as high as 10°C or greater. In their Abstract, Schmittner et al. summarized their findings:
Assessing impacts of future anthropogenic carbon emissions is currently impeded by uncertainties in our knowledge of equilibrium climate sensitivity to atmospheric carbon dioxide doubling. Previous studies suggest 3 K as best estimate, 2–4.5 K as the 66% probability range, and non-zero probabilities for much higher values, the latter implying a small but significant chance of high-impact climate changes that would be difficult to avoid. Here, combining extensive sea and land surface temperature reconstructions from the Last Glacial Maximum with climate model simulations we estimate a lower median (2.3 K) and reduced uncertainty (1.7–2.6 K 66% probability). Assuming paleoclimatic constraints apply to the future as predicted by our model, these results imply lower probability of imminent extreme climatic change than previously thought.
Anther paper with a warm reception from the lukewarmers was published by Gillett et al. (in actuality, this paper was published during the first week of 2012, but was accepted for publication in late 2011, so I’ll go ahead and include it here). Gillett and colleagues used the character and evolution of the global average temperature from 1851 through 2010 to bend the output of a climate model to best fit reality (or at least reality as captured by the Hadley Centre/Climate Research Unit global average temperature compilation). In doing so, Gillett and colleagues concluded that the temperature rise over the course of the 21st century is probably going to be considerably less than their raw climate model projections suggest. In fact, they write in their paper titled “Improved constraints on 21st-century warming derived using 160 years of temperature observations” that:
“Our analysis also leads to a relatively low and tightly-constrained estimate of Transient Climate Response of 1.3–1.8°C, and relatively low projections of 21st-century warming under the Representative Concentration Pathways.”
Basically, they found that when their climate model is constrained by reality over the past 160 years, that the temperature projections for the end of the 21st century are reduced by about 33%. This is a result of a similar magnitude as determined by Santer et al.
2011 (Dis)Honorable Mention
I would be remiss is my review of the climate stories of 2011 if I failed to mention the release of another round of Climategate emails. The so-called Climategate 2.0 emails further many of the storylines that ran throughout the original Climategate releases back in November 2009—rampant gatekeeping, data hoarding, and general misbehavior.
To me, the most significant thing that the Climategate emails show is that the deck is stacked against the publication of research results that are critical of the established scientific consensus and that the skids are greased for papers that run in support. It is little wonder why the literature is as one-sided as it is on the issue. The folks who are responsible for establishing the consensus have also taken it upon themselves to be the protectors of it. Not a good situation for the advancement of science.
All of which double goes to show that the papers which do make it through to publication and which chink away at the icon of alarming climate change quite likely are actually on to something.
Bottom Line
So what I have documented is a collection of observations and analysis that together is telling a story of relatively modest climate changes to come. Not that temperatures won’t rise at all over the course of this century, but rather than our climate becoming extremely toasty, it looks like we’ll have to settle (thankfully) for it becoming only lukewarm.
My guess is that 2012 will hold more good news for lukewarmers, both in terms of supportive scientific findings, and also in a migration of folks towards the middle of this issue. As being lukewarm becomes a bit more comfortable, I imagine that more folks will be drawn in (and maybe my lunch calendar will start to fill up!)
References:
Foster, G., and S. Rahmstorf, 2011. Global temperature evolution 1979-2010. Environmental Research Letters, 6, 044022, doi:10.1088/1748-9326/6/4/044022
Gillett, N.P., et al., 2012. Improved constraints on 21st-century warming derived using 160 years of temperature observations. Geophysical Research Letters, 39, L01704, doi:10.1029/2011GL050226.
Santer, B.D., et al., 2011. Separating Signal and Noise in Atmospheric Temperature Changes: The Importance of Timescale. Journal of Geophysical Research, doi:10.1029/2011JD016263.
Schmittner, A., et al., 2011. Climate sensitivity estimated from temperature reconstructions of the Last Glacial Maximum. Science, 334, 1385-1388, doi:10.1126/science.1203513 .
Source:
Anyone can join.
Anyone can contribute.
Anyone can become informed about their world.
"United We Stand" Click Here To Create Your Personal Citizen Journalist Account Today, Be Sure To Invite Your Friends.
Please Help Support BeforeitsNews by trying our Natural Health Products below!
Order by Phone at 888-809-8385 or online at https://mitocopper.com M - F 9am to 5pm EST
Order by Phone at 866-388-7003 or online at https://www.herbanomic.com M - F 9am to 5pm EST
Order by Phone at 866-388-7003 or online at https://www.herbanomics.com M - F 9am to 5pm EST
Humic & Fulvic Trace Minerals Complex - Nature's most important supplement! Vivid Dreams again!
HNEX HydroNano EXtracellular Water - Improve immune system health and reduce inflammation.
Ultimate Clinical Potency Curcumin - Natural pain relief, reduce inflammation and so much more.
MitoCopper - Bioavailable Copper destroys pathogens and gives you more energy. (See Blood Video)
Oxy Powder - Natural Colon Cleanser! Cleans out toxic buildup with oxygen!
Nascent Iodine - Promotes detoxification, mental focus and thyroid health.
Smart Meter Cover - Reduces Smart Meter radiation by 96%! (See Video).


| Online: | |
| Visits: | 1,602,341,985 |
| Stories: | 8,146,988 |
Whistler Blowers, Insiders
