
This Map Shows What $100 Is Actually Worth in Your State (Video)


Money goes further in some states than others.
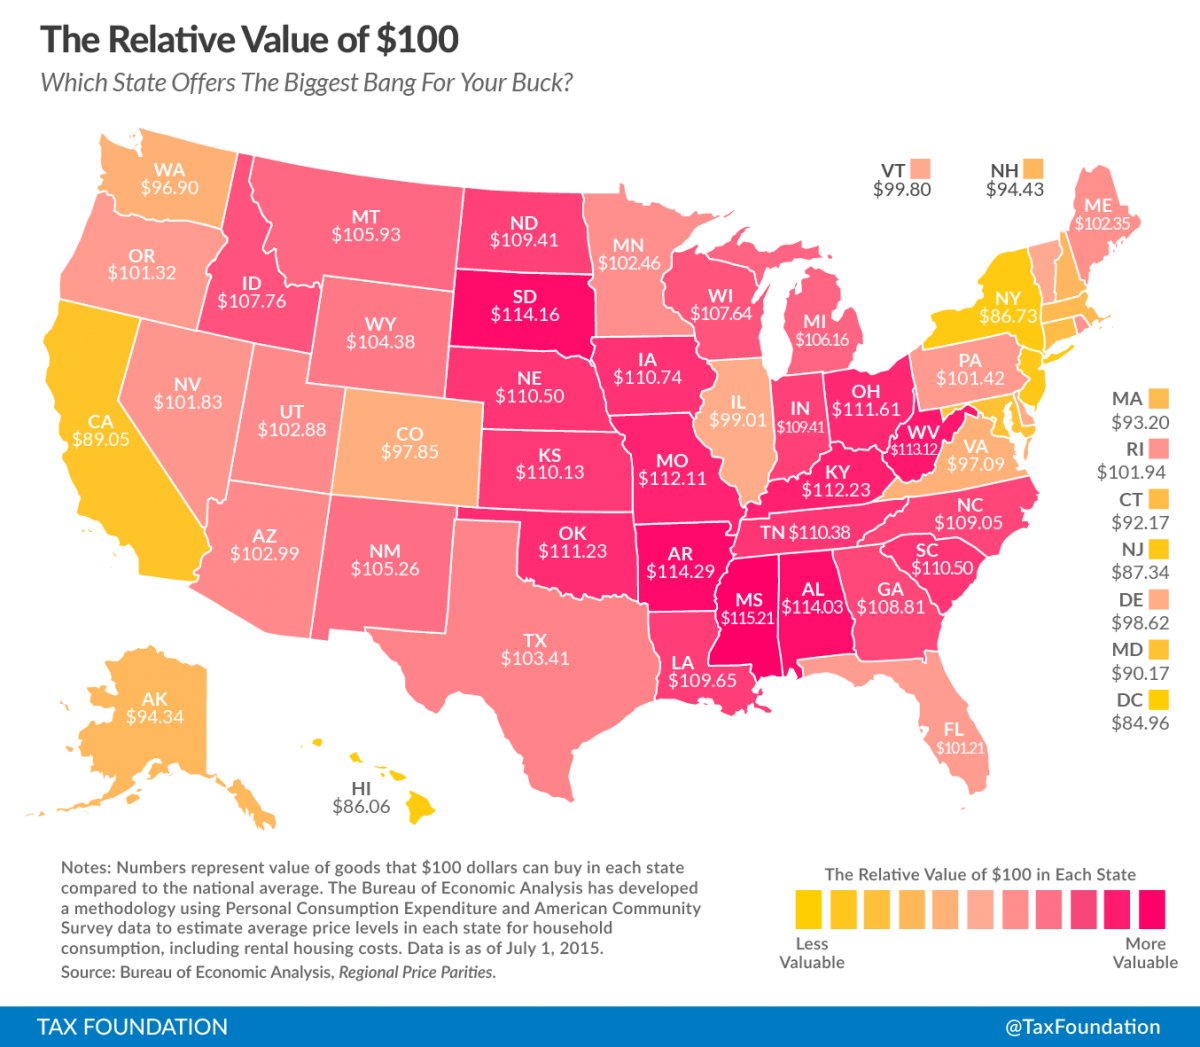
The Tax Foundation released a map showing the relative value of $100 in every state compared with the national average using the data from the Bureau of Economic Analysis.
In expensive states like New York, you can afford comparatively less than average; in less expensive states like Mississippi, you can buy relatively more.
“Regional price differences are strikingly large; real purchasing power is 36 percent greater in Mississippi than it is in the District of Columbia,” writes the Tax Foundation. “In other words: by this measure, if you have $50,000 in after tax income in Mississippi, you would have to have after-tax earnings of $68,000 in the District of Columbia just to afford the same overall standard of living.”
Here’s the map:
The states with the largest relative value of $100 were:
- Mississippi ($115.21)
- Arkansas ($114.29)
- South Dakota ($114.16)
- Alabama ($114.03)
- West Virginia ($113.12)
The states with the smallest relative value of $100 were:
- District of Columbia ($84.96)
- Hawaii ($86.06)
- New York ($86.73)
- New Jersey ($87.34)
- California ($89.05)
Business Insider – by Elena Holodny
Check out more contributions by Jeffery Pritchett ranging from UFO to Bigfoot to Paranormal to Prophecy
~~~~~
Most people who use social media have figured out that Facebook and Google are in cahoots with the government. For those who are well aware of the issues, it’s high time you switched over to Seen.life. It is a website that is similar to Facebook but without all the censorship.
Firearm friendly, you may buy sell or trade anything allowed by site TOS rules.
Anyone can join.
Anyone can contribute.
Anyone can become informed about their world.
"United We Stand" Click Here To Create Your Personal Citizen Journalist Account Today, Be Sure To Invite Your Friends.
Before It’s News® is a community of individuals who report on what’s going on around them, from all around the world. Anyone can join. Anyone can contribute. Anyone can become informed about their world. "United We Stand" Click Here To Create Your Personal Citizen Journalist Account Today, Be Sure To Invite Your Friends.
LION'S MANE PRODUCT
Try Our Lion’s Mane WHOLE MIND Nootropic Blend 60 Capsules
Mushrooms are having a moment. One fabulous fungus in particular, lion’s mane, may help improve memory, depression and anxiety symptoms. They are also an excellent source of nutrients that show promise as a therapy for dementia, and other neurodegenerative diseases. If you’re living with anxiety or depression, you may be curious about all the therapy options out there — including the natural ones.Our Lion’s Mane WHOLE MIND Nootropic Blend has been formulated to utilize the potency of Lion’s mane but also include the benefits of four other Highly Beneficial Mushrooms. Synergistically, they work together to Build your health through improving cognitive function and immunity regardless of your age. Our Nootropic not only improves your Cognitive Function and Activates your Immune System, but it benefits growth of Essential Gut Flora, further enhancing your Vitality.

Our Formula includes: Lion’s Mane Mushrooms which Increase Brain Power through nerve growth, lessen anxiety, reduce depression, and improve concentration. Its an excellent adaptogen, promotes sleep and improves immunity. Shiitake Mushrooms which Fight cancer cells and infectious disease, boost the immune system, promotes brain function, and serves as a source of B vitamins. Maitake Mushrooms which regulate blood sugar levels of diabetics, reduce hypertension and boosts the immune system. Reishi Mushrooms which Fight inflammation, liver disease, fatigue, tumor growth and cancer. They Improve skin disorders and soothes digestive problems, stomach ulcers and leaky gut syndrome. Chaga Mushrooms which have anti-aging effects, boost immune function, improve stamina and athletic performance, even act as a natural aphrodisiac, fighting diabetes and improving liver function. Try Our Lion’s Mane WHOLE MIND Nootropic Blend 60 Capsules Today. Be 100% Satisfied or Receive a Full Money Back Guarantee. Order Yours Today by Following This Link.


| Visits: | 1,825,766,153 |
| Stories: | 8,677,502 |
Whistler Blowers, Insiders

the tax foundation are idiots everyone knows the dollar is worth about 8 cent so 100 would be about 8 dollars