
Slowly Escaping New York: The New York Times?


The New York Times’ newspaper business continued to decline in 2010, as the circulation of the United States’ former newspaper of record further deteriorated beyond the grim milestone it passed in 2009.
According to documents filed with the U.S. Securities and Exchange Commission on 22 February 2011, the total circulation of the New York Times’ Sunday edition dropped by 3.4% from 2009 to 2010 to 1,356,000, while the circulation of the New York Times’ weekday edition plunged by 5.5% to 906,100. In 2009, the average total circulation of the weekday edition of the New York Times had dropped below the one million mark for the first time in decades.
Examining the circulation data the New York Times has published in its annual reports since 1993, we’ve discovered that the New York Times appears to be systematically abandoning its presence in the 31 counties in the New York City metropolitan area that make up its traditional home market in favor of expanding nationally and on the Internet.
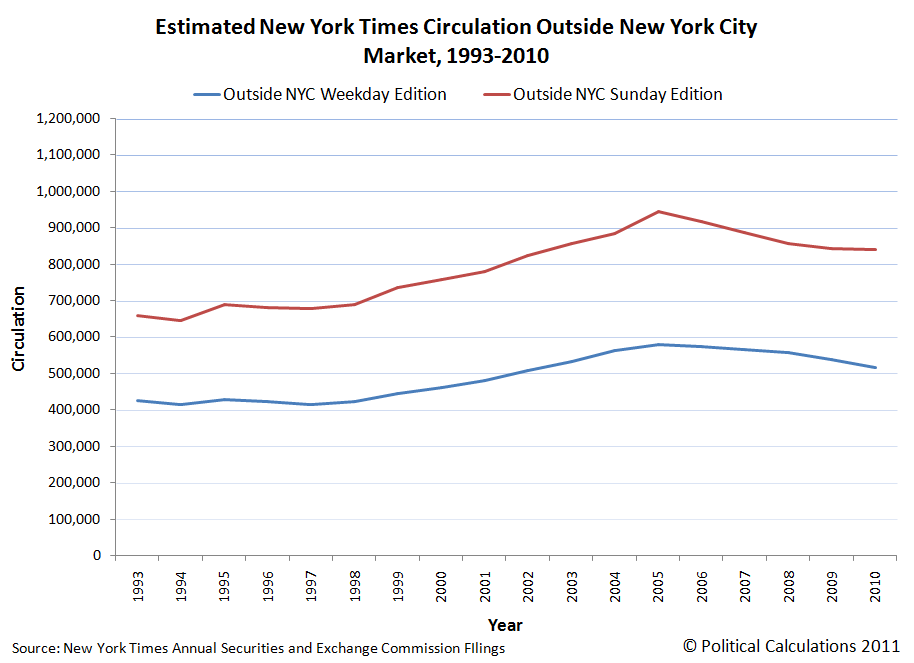
The charts below show how the circulation for both the New York Times’ Sunday and weekday editions has changed since last peaking in 1993, first within its New York City home market (left) and outside of its home market (right):
The New York Times’ strategy to expand nationally appears to have been initiated in 1997 or early 1998. By contrast, it appears that the decision to slowly wind down the newspaper’s presence in the New York City market took place in 2001, as the newspaper’s weekday circulation began a steady decline in the years following 2001 after holding level for four years in its home market. This outcome suggests a conscious decision on the part of the New York Times’ management to either stop trying to sustain the newspaper’s circulation levels in New York City or to systematically draw down its presence in its home market to devote its resources to other areas.
In either case, those resources appear to have been diverted to support the newspaper’s national expansion, which accelerated in the years from 2001 to 2005. It appears however that the newspaper’s national strategy then topped out in 2005, as its national circulation has fallen off since. The circulation of the newspapers’ national weekday edition has continued to decline, but at a considerably less steep rate than its home market editions, while its Sunday edition circulation appears to have stabilized as of 2010.
The chart and table below presents the New York Times’ weekday edition circulation data for the years since 1993, as taken or calculated from information provided by the newspaper’s SEC filings:
| New York Times Average Weekday Circulation, 1993 through 2009 | |||||
|---|---|---|---|---|---|
| Year | Weekday Circulation (Mon-Fri) | Weekday Percentage of Total Circulation in NYC | Weekday Circulation Within NYC Market | Weekday Circulation Outside NYC Market | Percentage Decline of Total Weekday Circulation |
| 1993 | 1,183,100 | 64 | 757,184 | 425,916 | 0.0 |
| 1994 | 1,148,800 | 64 | 735,232 | 413,568 | -2.9 |
| 1995 | 1,124,300 | 62 | 697,066 | 427,234 | -5.0 |
| 1996 | 1,111,800 | 62 | 689,316 | 422,484 | -6.0 |
| 1997 | 1,090,900 | 62 | 676,358 | 414,542 | -7.8 |
| 1998 | 1,088,100 | 61 | 663,741 | 424,359 | -8.0 |
| 1999 | 1,109,700 | 60 | 665,820 | 443,880 | -6.2 |
| 2000 | 1,122,400 | 59 | 662,216 | 460,184 | -5.1 |
| 2001 | 1,143,700 | 58 | 663,346 | 480,354 | -3.3 |
| 2002 | 1,131,400 | 55 | 622,270 | 509,130 | -4.4 |
| 2003 | 1,132,000 | 53 | 599,960 | 532,040 | -4.3 |
| 2004 | 1,124,700 | 50 | 562,350 | 562,350 | -4.9 |
| 2005 | 1,135,800 | 49 | 556,542 | 579,258 | -4.0 |
| 2006 | 1,103,600 | 48 | 529,728 | 573,872 | -6.7 |
| 2007 | 1,066,600 | 47 | 501,302 | 565,298 | -9.8 |
| 2008 | 1,033,800 | 46 | 475,548 | 558,252 | -12.6 |
| 2009 | 959,200 | 44 | 422,048 | 537,152 | -18.9 |
| 2010 | 906,100 | 43 | 389,623 | 516,477 | -23.4 |
The chart and table below presents the New York Times’ Sunday edition circulation data for the years since 1993, as taken or calculated from information provided by the newspaper’s SEC filings:
| New York Times Average Sunday Circulation, 1993 through 2010 | |||||
|---|---|---|---|---|---|
| Year | Sunday Circulation | Sunday Percentage of Total Circulation in NYC | Sunday Circulation Within NYC Market | Sunday Circulation Outside NYC Market | Percentage Decline of Total Sunday Circulation |
| 1993 | 1,783,900 | 63 | 1,123,857 | 660,043 | 0.0 |
| 1994 | 1,742,200 | 63 | 1,097,586 | 644,614 | -2.3 |
| 1995 | 1,720,300 | 60 | 1,032,180 | 688,120 | -3.6 |
| 1996 | 1,701,800 | 60 | 1,021,080 | 680,720 | -4.6 |
| 1997 | 1,651,400 | 59 | 974,326 | 677,074 | -7.4 |
| 1998 | 1,638,900 | 58 | 950,562 | 688,338 | -8.1 |
| 1999 | 1,671,200 | 56 | 935,872 | 735,328 | -6.3 |
| 2000 | 1,686,700 | 55 | 927,685 | 759,015 | -5.4 |
| 2001 | 1,659,900 | 53 | 879,747 | 780,153 | -7.0 |
| 2002 | 1,682,100 | 51 | 857,871 | 824,229 | -5.7 |
| 2003 | 1,682,100 | 49 | 824,229 | 857,871 | -5.7 |
| 2004 | 1,669,700 | 47 | 784,759 | 884,941 | -6.4 |
| 2005 | 1,684,700 | 44 | 741,268 | 943,432 | -5.6 |
| 2006 | 1,637,700 | 44 | 720,588 | 917,112 | -8.2 |
| 2007 | 1,529,700 | 42 | 642,474 | 887,226 | -14.2 |
| 2008 | 1,451,300 | 41 | 595,033 | 856,267 | -18.6 |
| 2009 | 1,405,200 | 40 | 562,080 | 843,120 | -21.2 |
| 2010 | 1,356,800 | 38 | 515,584 | 841,216 | -23.9 |
Even with these circulation declines, the New York Times Company was able to post a net profit in 2010 of $107.7 million, even though the company’s total revenue fell by 1.9%, from $2.44 billion in 2009 to $2.39 billion in 2010, as the company profited by reducing its costs and its payroll in both 2009 and 2010. At present, we would expect the erosion of the New York Times circulation to continue, given its management’s new focus on promoting and generating revenue from its Internet operations.
We wonder at what circulation level will the New York Times’ management dispense with the pretense of being a New York City newspaper.
Disclosure: Ironman does not hold any positions in the New York Times (NYSE: NYT).
Anyone can join.
Anyone can contribute.
Anyone can become informed about their world.
"United We Stand" Click Here To Create Your Personal Citizen Journalist Account Today, Be Sure To Invite Your Friends.
Please Help Support BeforeitsNews by trying our Natural Health Products below!
Order by Phone at 888-809-8385 or online at https://mitocopper.com M - F 9am to 5pm EST
Order by Phone at 866-388-7003 or online at https://www.herbanomic.com M - F 9am to 5pm EST
Order by Phone at 866-388-7003 or online at https://www.herbanomics.com M - F 9am to 5pm EST
Humic & Fulvic Trace Minerals Complex - Nature's most important supplement! Vivid Dreams again!
HNEX HydroNano EXtracellular Water - Improve immune system health and reduce inflammation.
Ultimate Clinical Potency Curcumin - Natural pain relief, reduce inflammation and so much more.
MitoCopper - Bioavailable Copper destroys pathogens and gives you more energy. (See Blood Video)
Oxy Powder - Natural Colon Cleanser! Cleans out toxic buildup with oxygen!
Nascent Iodine - Promotes detoxification, mental focus and thyroid health.
Smart Meter Cover - Reduces Smart Meter radiation by 96%! (See Video).


| Online: | |
| Visits: | 1,604,097,415 |
| Stories: | 8,152,172 |
Whistler Blowers, Insiders
