
Wilcon Depot’s Q2 2023 Sales and Income Growth Slump from Corroding Macroeconomic Forces New Stores, and Disinflation

Every boom that is based on inflation, rather than on real earnings, is doomed to fail. Because, as French economist Jean-Baptiste Say put it, you buy products with products, not with money—Bill Bonner
In this issue
Wilcon Depot’s Q2 2023 Sales and Income Growth Slump from Corroding Macroeconomic Forces, New Stores, and Disinflation
I. Macroeconomic Forces Weighed on WLCON’s Financials
II. Slump in Net Income: Surging Operating Costs from New Stores and Record High-Interest Expenses
III. Wilcon’s Inflation-Fueled Boom, Disinflation Driven-Bust?
Wilcon Depot’s Q2 2023 Sales and Income Growth Slump from Corroding Macroeconomic Forces, New Stores, and Disinflation
Wilcon Depot reported a sharp growth slowdown in sales and income. Macroeconomic forces, costs from new store openings, and disinflation played crucial roles.
I. Macroeconomic Forces Weighed on WLCON’s Financials
Wilcon Depot [PSE: WLCON] has almost always been the earliest among the PSEi 30 members to report on their 17Q (Quarterly Report), so this gives us some elbow room to conduct a terse inquiry on the company’s financial standing.
As a market leader in the downstream real estate industry—home improvement and construction supplies retailer—the firm’s financial conditions serve as a stethoscope of the health of middle and high-income consumers.
First, below are excerpts of news coverage on WLCON’s 2Q performance… (bold added)
Manila Standard, July 27, 2023: Wilcon Depot Inc., a leading home improvement and finishing construction supplies retailer, said Thursday second-quarter net income fell 15 percent to P856 million from P1 billion in the same period last year on lower foot traffic and transaction count. Wilcon said in a disclosure to the stock exchange second-quarter net sales inched up by 4 percent to P8.62 billion, thanks to the contribution of newly-opened stores.
ABS-CBN, July 27, 2023: In a statement, president and CEO Lorraine Belo-Cincochan blamed the decrease in net income on lower foot traffic in some of their stores. “We have a high base since there was pent-up demand for the same period last year as we just came out of the Omicron surge, plus there was a slowdown in private construction especially in April with its consecutive long weekends,” she said. “Historically, months with longer holiday stretches were periods with relatively lower sales since construction projects are usually also paused to save on labor cost or homeowners go on holiday themselves,” he explained. …Wilcon said four new stores were opened from January to June while 2 were closed, which brings their total store count to 85.
The Philippine Statistics Authority (PSA) uses the construction material retail (CMRPI) and wholesale price (CMWPI) indices as estimates for the sector’s price changes. The CMWPI measures construction materials used in government projects, while CMRPI represents the average prices in the National Capital Region (NCR).

Figure 1
The CMPI peaked at 11.04% in October 2022, while the CMRPI hit a zenith of 7% in July 2022. Then, price inflation for both was at multi-year highs. Yet from their respective pinnacle, it has been downhill. June 2023 reported growth rates of 5.9% and 1.9%. Of course, the stark difference between their growth rates signifies a peculiar phenomenon. (Figure 1, topmost chart)
Or, why should price inflation in the construction materials in the government projects be significantly higher than the retail?
Nonetheless, accompanying this downturn has been the slowdown of bank lending to the construction industry, which hit a plateau in the 2H of 2022.
The industry’s GDP has also resonated with the above. Although all three sectors—Government, Corporations, and Households—boomed in 2021, the downturn in bank lending, which peaked in Q2-Q3 2022, coincided with a slower GDP pace in 2022. Q1 2023 ‘real’ GDP bounced for the Corporations and Households, up by 20.6% and 13.3%. The government construction GDP subsided to 4.7%. (Figure 2, middle and lowest graphs)
In Q1 2023, corporations have the largest (46.1%) pie, followed by households (30.1%) and the government (23.8%). The overlapping or conjunct functions translate to imprecise qualifications of the cited numbers. Or, the categorization isn’t black and white. Private-Public Partnerships (PPP) are examples of entwined economic activities.
At any rate, the lower demand for funds extrapolates into decreased activities, further reinforced by falling construction material prices.
Or, a cutback in new edifices translates to reduced demand for interior furnishing, decorations, and other post-construction activities.
Since the deceleration involved the upstream, the lagged transmission has yet to diffuse into the downstream—WLCON’s market.
It is, therefore, unsurprising that the macroeconomic dynamics have started to impact WLCON’s performance.
II. Slump in Net Income: Surging Operating Costs from New Stores and Record High-Interest Expenses
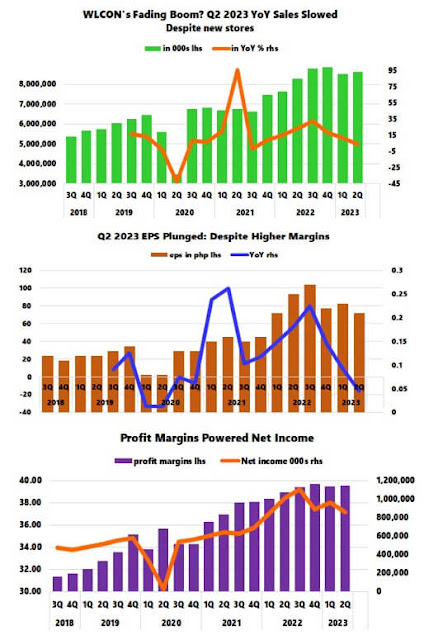
Figure 2
Despite the new stores, WLCON‘s sales grew by only 4.03% in Q2 (YoY) and 7.6% in 1H 2023, which means that Q2 weighed on Q1′s 11.44% growth. (Figure 2, topmost chart)
The Q2 growth downturn in sales plus other internal factors caused the firm’s income to fall by 14.9%, or its eps plunged by 16%. (Figure 2, middle diagram)
Why the slump in net income?
The company’s published gross margins of 39.5% in Q2 signifies the second highest since it soared to 39.4% in Q3 2022. Q4 2022 represents an all-time high of 39.7%. (Figure 2, lowest graph)
Aside from the topline growth, widening margins have lavishly delivered WLCON’s bottom line.
But margins were a consequence of falling costs of sales. Ironically, while price inflation rose, their cost of sales plunged. Amazing.
So aside from being able to use higher inflation to justify price increases via a pass-through to consumers (see CMRPI above and CORE CPI below), diving costs amplified their margins.

Figure 3
WLCON’s balance sheet has no published debt. But it pays interest expenses, which in nominal terms have ballooned to a record. And leases, also at a milestone high, have been the only major category of liabilities, which indicates a likely bundling with debt.
And while nominal levels are at all-time highs, growth rates have recently been slowing. The thing is, interest rate expenses continue to outpace revenue and income growth. Yet, if sustained, this will likely pose a significant roadblock to its bottom line. (Figure 3, top and middle windows)
In Q2, operating expenses zoomed by 19.94% YoY, primarily from growth of depreciation and amortization (13.44%), Salaries, wages, and employee benefits (13.53%), and rent (85.4%). Their aggregate share of the total operating costs was 49.2%, likely from new stores.
Operating costs increased by 21.1% in 1H 2023. (Figure 3, lowest pane)
The crux, instead of helping boost the bottom line, new stores weighed on WLCON’s operations. Additionally, rising interest-bearing lease liabilities continue to gnaw on earnings.
III. Wilcon’s Inflation-Fueled Boom, Disinflation Driven-Bust?
Last March, we suggested that WLCON was a beneficiary of inflation for three reasons: Sales growth coincided with credit card growth, Sales grew along with the CPI, and profit margin expansion from topline growth.
These three factors remain in place.
Since the middle and upper-income levels comprise WLCON’s customers, a significant portion of their sales may have been financed by credit cards.

Figure 4
Although the nominal levels of bank credit card growth continue to carve record highs, it appears to be plateauing, as indicated by the % YoY growth. The cresting use of credit cards may have diffused into WLCON’s topline. (Figure 4)

Figure 5
Second, WLCON’s sales corresponded with the CORE CPI.
Importantly, it has dovetailed with the Furnishing, Household Equipment, and routine household maintenance CPI, which shouldn’t surprise, given that the latter represents WLCON’s product lines.
(Figure 5)
Lastly, reinforcing the above discussion on profit margins, the CMRPI and the Core (Furnishing, Household Equipment, and Maintenance) CPI exhibits the likely inflation pass-through to consumers.
So there you have it.
Wilcon Depot seems to have benefited immensely from the inflationary and redistributional effects of bank credit and the BSP’s liquidity expansion.
It should be interesting to see how the company performs when the consumer cuts back on credit cards for a variety of reasons, such as overleverage, job or income losses, higher debt servicing costs, a combination of the above and others.
“Resilient” consumers?
Through an era of the low-interest regime, the mainstream has been misguided into thinking that there is little cost from its redistribution, unfettered credit-financed spending that led to a cluster of malinvestments, and that the artificially induced boom would last in perpetuity.
The takeaway; if price inflation had been instrumental in bolstering WLCON’s topline, disinflation, likely through falling use of credit cards, could most upend this dynamic.
It is happening.
Postscript: As of July 27th, based on Q2 2023 eps, WLCON’s annualized PER stood at 26.14, which is quite pricey considering the above scenario.
Source: http://prudentinvestornewsletters.blogspot.com/2023/07/wilcon-depots-q2-2023-sales-and-income.html
Anyone can join.
Anyone can contribute.
Anyone can become informed about their world.
"United We Stand" Click Here To Create Your Personal Citizen Journalist Account Today, Be Sure To Invite Your Friends.
Please Help Support BeforeitsNews by trying our Natural Health Products below!
Order by Phone at 888-809-8385 or online at https://mitocopper.com M - F 9am to 5pm EST
Order by Phone at 866-388-7003 or online at https://www.herbanomic.com M - F 9am to 5pm EST
Order by Phone at 866-388-7003 or online at https://www.herbanomics.com M - F 9am to 5pm EST
Humic & Fulvic Trace Minerals Complex - Nature's most important supplement! Vivid Dreams again!
HNEX HydroNano EXtracellular Water - Improve immune system health and reduce inflammation.
Ultimate Clinical Potency Curcumin - Natural pain relief, reduce inflammation and so much more.
MitoCopper - Bioavailable Copper destroys pathogens and gives you more energy. (See Blood Video)
Oxy Powder - Natural Colon Cleanser! Cleans out toxic buildup with oxygen!
Nascent Iodine - Promotes detoxification, mental focus and thyroid health.
Smart Meter Cover - Reduces Smart Meter radiation by 96%! (See Video).


| Online: | |
| Visits: | 1,600,234,283 |
| Stories: | 8,141,575 |
Whistler Blowers, Insiders
