
PSEi 30 2Q and 1H Performance Echoed the "Shocking" 4.3% GDP Dive; San Miguel’s Interest Expense Skyrockets!

It is dangerous to be right in matters on which the established authorities are wrong. – Voltaire
In this Issue
PSEi 30 2Q and 1H Performance Echoed the “Shocking” 4.3% GDP Dive; San Miguel’s Interest Expense Skyrockets!
I. The BSP’s (3Rs) Repricing, Refinancing, and Repayment Risks (3Rs) Redux
II. San Miguel a Case of Minsky’s Financial Instability Theory? SMC’s Debt Hits Php 1.338 TRILLION as Interest Expense Skyrocket!
III. Shades of the “Shocking” GDP: PSEi 30 Revenues and Income Growth Rate Dived in Q2 2023
IV. Debt Isn’t a Blunt Statistic; It Is the Lifeblood of the Modern Fiat Money Based Economy
V. PSEi 30: 2Q and 1H Performance by Sectors
VI. PSEi 30 2Q and 1H Performance by Members
PSEi 30 2Q and 1H Performance Echoed the “Shocking” 4.3% GDP Dive; San Miguel’s Interest Expense Skyrockets!
The Philippine PSEi 30 performance resonated with the “shocking” dive in the (4.3%) Q2 & (5.3%) H1 GDP. San Miguel’s debt hit Php 1.338 TRILLION while interest expenses zoomed!
I. The BSP’s (3Rs) Repricing, Refinancing, and Repayment Risks (3Rs) Redux
The higher debt levels must now be managed against rising interest rates and peso depreciation. Several studies suggest that higher levels of debt relative to economic output generally leave the financial system to be more vulnerable. In particular, debt servicing capacity of highly leveraged borrowers becomes progressively more sensitive to drops in income and sales as well as increases in interest rates. For a given shock, higher debt could result in a higher probability of default. As deleveraging starts to unfold, consumption and investment fall, ultimately affecting economic growth (FSCC, 2018)
An exposition of the present? Nope.
This quote was from the venerable late BSP Governor Nestor Espenilla Jr.’s 2017 Financial Stability Report (FSR). It was a discourse on the economic conditions of 2017.
But there’s a difference: A critical one.
The economy’s debt levels, CPI rates, interest rates, and the USDPHP have been substantially higher today than in 2017, which, if still alive, should amplify the late Governor’s concern.
Another excerpt from the same FSR:
As a matter of fact, firms listed in the PSE exhibited a rising debt-to-equity ratio, from about 45 percent in 2008 to more than 86 percent as of end-March 2018 (FSCC, 2018)
Once more, the balance sheets of the elite members of the PSEi 30, comprising the principal benchmark of the Philippine Stock Exchange (PSE), have been more levered compared to 2017.
If inflation, rising rates, and elevated debt levels prompted the late Governor Espenilla to warn…
While there is no definitive evidence of a looming crisis, it is also clear that shocks that have caused dislocations of crisis proportions have come as a surprise. What is not debatable is that repricing, refinancing and repayment risks (3Rs) are escalated versus last year and this could result in systemic risk if not properly addressed in a timely manner. (FSCC, 2018)
…why has everyone been ignoring or neglecting conditions that are far worse today than in 2017?
This outlook will deal with their 2Q/1H 17Q reports from five perspectives: San Miguel’s transitions, an overview of the PSEi 30, an explanation of debt, the PSEi performance by industry, and individual outcomes.
II. San Miguel a Case of Minsky’s Financial Instability Theory? SMC’s Debt Hits Php 1.338 TRILLION as Interest Expense Skyrocket!

Figure 1
We begin this treatise with an inquiry on the most leveraged company, San Miguel Corporation [PSE: SMC], which debt reached the second highest level in Q2 at an eye-popping Php 1.338 TRILLION! To emphasize: TRILLION! (Figure 1, upper chart)
As of August 18th, SMC’s market cap was at Php 249.75 billion. In Q2, SMC’s debt grew by an astounding Php 214.4 billion or 19.1% YoY and Php 59.1 billion or 4.6% QoQ. So the amount of debt added to its portfolio signified about 85% of its market cap!
From a systemic level, SMC’s Q2 debt represented about 4.7% and 5.7% of the TOTAL and BANK Financial Resources of Php 28.53 trillion and Php 23.5 trillion (as of May 2023)!
SMC’s extensive and mounting (declared) debt exposure showcases the escalating concentration risks of the financial system. And despite being a privileged borrower, its interest expense exploded in the last three quarters, representing the increased debt stock and rising rates here and abroad.
Interest expense vaulted by 49.17% YoY Q4 2022, 76.33% Q1 and 73.7% Q2 2023 as the BSP and the US Fed raised rates. A substantial portion of SMC’s debts are foreign-denominated (upwards 35%). (Figure 1, lower graph)
In the meantime, SMC suffered a 14.2% drop in Q2 revenues and a 4.71 % decrease in income to Php 5.59 billion, which weighed on 1H revenues (-3.7%) but still posted a 17.8% increase in published income to Php 23.325 billion. (see figure/table 6 below)
Or, in 1H 2023, SMC borrowed 214.4 billion to produce a paltry income of Php 23.325 billion!
That is to say, to repay its existing liabilities, given the volatility of and the increasing risks of diminishing cash streams, SMC requires even more extensive borrowings (and) or the liquidation of its assets, which in the words of economist Hyman Minsky in describing Ponzi units, “lowers the margin of safety that it offers the holders of its debts.” (Minsky, 1992)
Briefly, SMC entirely depends on a persistent reign of easy money to sustain its operations based on political entrepreneurship.
But this borrow-to-churn profits business model is not just about SMC; it epitomizes the business models of present-day enterprises as signified by the elite members of the PSE.
III. Shades of the “Shocking” GDP: PSEi 30 Revenues and Income Growth Rate Dived in Q2 2023

Figure 2
Remember the “shocking” 4.3% Q2 2023 headline GDP?
It reverberated with the PSEi 30.
Q2 2023 revenue growth rate of the PSEi 30 firms plunged from 37.7% in 2022 to 8.24% in 2023. (Figure 2, topmost chart)
The published net income growth rate in Q2 also more than halved, from 52.13% in 2022 to 20.4%. (Figure 2, middle window)
In turn, revenue and income growth rates dropped from 30.56% and 33.06% in 1H 2022 to 12.63% and 20.6% this year.
That’s not all.
In pesos, 1H 2023 marginal revenues increased by Php 372.364 billion, while marginal net income grew by Php 84.659 billion; these were substantially lower than their counterparts of Php 678.08 billion and Php 95.29 billion in 2022. (Figure 2, lowest graph)
The thing is, though aggregate net income rose to a record, marginal net income has slowed.

Figure 3
How about the published debt?
First, the good news? The growth rate of non-financial corporate PSEi 30 debt slowed too. It clocked at 12.9% in 2022 but posted only a 7.4% rate this year.
But percentages signify a facade. That’s because, unlike revenues and income, debt is cumulative and compared with a high base.
Unmistakably, debt outgrew income.
In pesos, the published marginal debt increase was Php 389.5 billion, even as net income expanded by Php 84.659 billion. (Figure 3, upper graph)
Or, the PSEi 30 borrowed 4.6 pesos for every peso income it generated!
Borrowings here exclude PSEi 30 banks.
The media and companies love to holler about % growth, but like the GDP, it’s a different scenario seen from marginal peso changes.
So, when the late Governor Espenilla Jr. was anxious about rising rates in the face of expansive debt, six years after, the degree of systemic leverage turned for the worst.
IV. Debt Isn’t a Blunt Statistic; It Is the Lifeblood of the Modern Fiat Money Based Economy
Debt is not just an inert statistic. It is the lifeblood of the modern fiat money standard economy that provides financing to the intricate lattice network of demand and supply chains.
First, credit links the downstream to the midstream to the upstream of any industry.
For instance, consumers use credit cards of listed banks to acquire goods or services from retail chains. Many of these retail chains obtain inputs through credit and so forth.
Second, it also links public and private sector activities.
Another example. A public infrastructure project, integral to the deficit financing partly funded by debt, undertaken by a political agency subcontracts labor (e.g., project management) and (or) acquires inputs from the private sector (e.g., cement). Debt-financed public spending activities percolate into the revenues & P/Ls of participating private firms and their ancillary networks.
Third, it also links activities of the horizontal or lateral business stages.
As an illustration: A listed company pursues “horizontal integration” through mergers and acquisitions (M&A) financed by debt. Think of listed elite food companies acquiring smaller competitors.
Unmistakably, debt has morphed from financing into a crucial driver of revenues and profits or economic activities.
In turn, it relies on the perpetuation of a low-interest rates regime.
On the other hand, an economy dependent on debt is not only afflicted by diminishing returns but a massive build-up of mismatches in the financial system expressed in the economy as increased malinvestments and heightened credit risks.
And this framework shows the interrelation of public and private debt, which is why debt-to-GDP is an entirely defective metric.
More pointedly, the idea that the firms or the economy could outgrow debt misleads because the latter drives the former (backward causation).
Nevertheless, the sharp slowdown of the lending portfolio of the banking system last June, coincident with the headline GDP and the growth rates of PSEi revenues and profit and debt, which are all interconnected, should not be a surprise.
The banking system’s Total Loan Portfolio (TLP), ex-Interbank and repo lending to the BSP and other banks, slipped from 10.4% to 6.9% last June. (Figure 3, lowest chart)
Again, it remains a mystery that the BSP has yet to release its depository survey, which exhibits the distribution of bank loans and therefore limits our discussion.
V. PSEi 30: 2Q and 1H Performance by Sectors

Figure/Table 4
Nonetheless, banks led the field in the 2Q and 1H with 55.85% and 54.01% in revenue gains and 26.3% and 32.54% in net income expansion on aggressive lending.
Banks also scored the largest peso gains in the 2Q with Php 54.2 billion and ranked second to the Holding Firm sector in 1H with Php 101,762 billion.
The property sector took the second spot. Revenues soared 30% and 26.3% in 2Q and 1H, while net income jumped by 39.7% and 34.3%, respectively.
In the context of debt, the industrials posted the second-largest increase at 11.09%, with a marginal gain of 49.584 billion. The holding firm sector accounted for 80% of this gain.
VI. PSEi 30 2Q and 1H Performance by Members

Figure/Table 5
In Q2, SMPH, GTCAP, and ACEN were leaders in the revenue growth segment with 39.06%, 36.4%, and 32.3%. In the marginal change in pesos, GTCAP and SM were in the driver’s seat with Php 20.9 billion and Php 19.4 billion.
Meanwhile, JGS and GTCAP posted the most net income increases, with triple-digit growths of 273.7% and 154%. JGS and SM posted the largest peso growth increases of Php 6.9 billion and Php 6.37 billion.
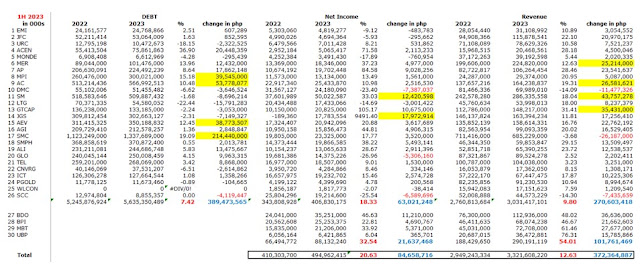
Figure/Table 6
In 1H, GTCAP and SMPH took the helm in the revenue growth segment with 31.4% and 29.2%.
In peso marginal changes, SM and GTCAP had the highest growth of Php 43.8 billion and 34.4 billion.
JGS was the runaway leader with a 9,490% increase in net income growth, which also translated to a net marginal increase of Php 17.9 billion.
Aside from SMC, the next three largest borrowers were AC (Php 53.8 billion), MPI (Php 39.5 billion), and AEV (Php 38.8 billion), which aggregate share accounted for a whopping 89% of the total!
Overall, debt reduction involved 9 of the 26 non-financial firms.
And these represent published debt. Some firms may have bundled debt to other segments, like lease liabilities.
In the end, the basic operating model espoused by these companies has expanded from “borrow-and-spend,” to repricing, refinancing, and repayments (3Rs).
This won’t end well.
____
References
Financial Stability Coordination Council (FSCC) 2017 FINANCIAL STABILITY REPORT June 2018, Bangko Sentral ng Pilipinas p 24
Ibid, p.22
Ibid, p. 27
Hyman P. Minsky, The Financial Instability Hypothesis, The Jerome Levy Economics Institute of Bard College May 1922, p.7
Source: http://prudentinvestornewsletters.blogspot.com/2023/08/psei-30-2q-and-1h-performance-echoed.html
Anyone can join.
Anyone can contribute.
Anyone can become informed about their world.
"United We Stand" Click Here To Create Your Personal Citizen Journalist Account Today, Be Sure To Invite Your Friends.
Please Help Support BeforeitsNews by trying our Natural Health Products below!
Order by Phone at 888-809-8385 or online at https://mitocopper.com M - F 9am to 5pm EST
Order by Phone at 866-388-7003 or online at https://www.herbanomic.com M - F 9am to 5pm EST
Order by Phone at 866-388-7003 or online at https://www.herbanomics.com M - F 9am to 5pm EST
Humic & Fulvic Trace Minerals Complex - Nature's most important supplement! Vivid Dreams again!
HNEX HydroNano EXtracellular Water - Improve immune system health and reduce inflammation.
Ultimate Clinical Potency Curcumin - Natural pain relief, reduce inflammation and so much more.
MitoCopper - Bioavailable Copper destroys pathogens and gives you more energy. (See Blood Video)
Oxy Powder - Natural Colon Cleanser! Cleans out toxic buildup with oxygen!
Nascent Iodine - Promotes detoxification, mental focus and thyroid health.
Smart Meter Cover - Reduces Smart Meter radiation by 96%! (See Video).


| Online: | |
| Visits: | 1,599,997,556 |
| Stories: | 8,140,959 |
Whistler Blowers, Insiders
