
How to Compare Stocks

Many investors are perplexed about how to compare stocks that they’re interested in for a specific sector or industry. How can you make sure you’ll pick the right one for your portfolio? Unsure, some investors buy a position in all of them, which is a mistake if you want a well-diversified portfolio. Let’s get some clarity on how to compare stocks and remove doubt.
Watch our video!
Apples to apples
Compare stocks from the same sector or better still, the same industry. Different sectors have different opportunities, risks, cycles, customers, margins, etc. Take Apple and Equinix. Other than both being low yield high growth companies, there isn’t much that’s comparable: one sells smartphones, tablets, wearables, and services; the other is a REIT specializing in digital infrastructure facilities for data centers.
Even within a sector, companies can be vastly different; Home Depot and Starbucks are in the same sector, but hardly similar; Starbucks and Wendy’s however, make for a better comparison.
Choose the sectors or industries you want to invest in. Do some preliminary window shopping to choose the stocks to compare. You might listen to podcasts, read articles, or read business news to get ideas.
Of course, most stocks in a thriving industry look good while all companies in a struggling industry look like garbage. That’s why analysing and comparing them is essential to make a good choice.
Learn how to make the most of each sector. Download our Recession-proof portfolio workbook
Information sources
You’ll find the information needed on company websites (quarterly earnings reports, investor presentations, news), finance websites, and more. It will be an easier task if you copy the data you find into columns in a spreadsheet, rather than constantly switching between browser tabs.
If you’re a DSR member, you’ll find almost all the information on the DSR website. DSR Pro members, save time by using the comparison tool and see over 30 metrics for multiple companies in a convenient side-by-side layout.
Comparing stocks
To compare stocks, you must look at both narrative and numbers.
- Narrative – The company’s strengths, how it makes money. Whether it’s a beloved long-established company or a trailblazing newcomer. In short, it’s all the talk that gets you enthusiastic about a company.
- Numbers – Metrics, and their trend over time, show the company’s performance, ability to consistently generate revenue, profit, and dividends, debt level, portion of profits it keeps for purposes other than dividends, and how the market values the company. The numbers either support or challenge the narrative.
Look at each of the items described next for each company; as you do so, you’ll gradually get a better idea of which companies to discard and which to consider buying.
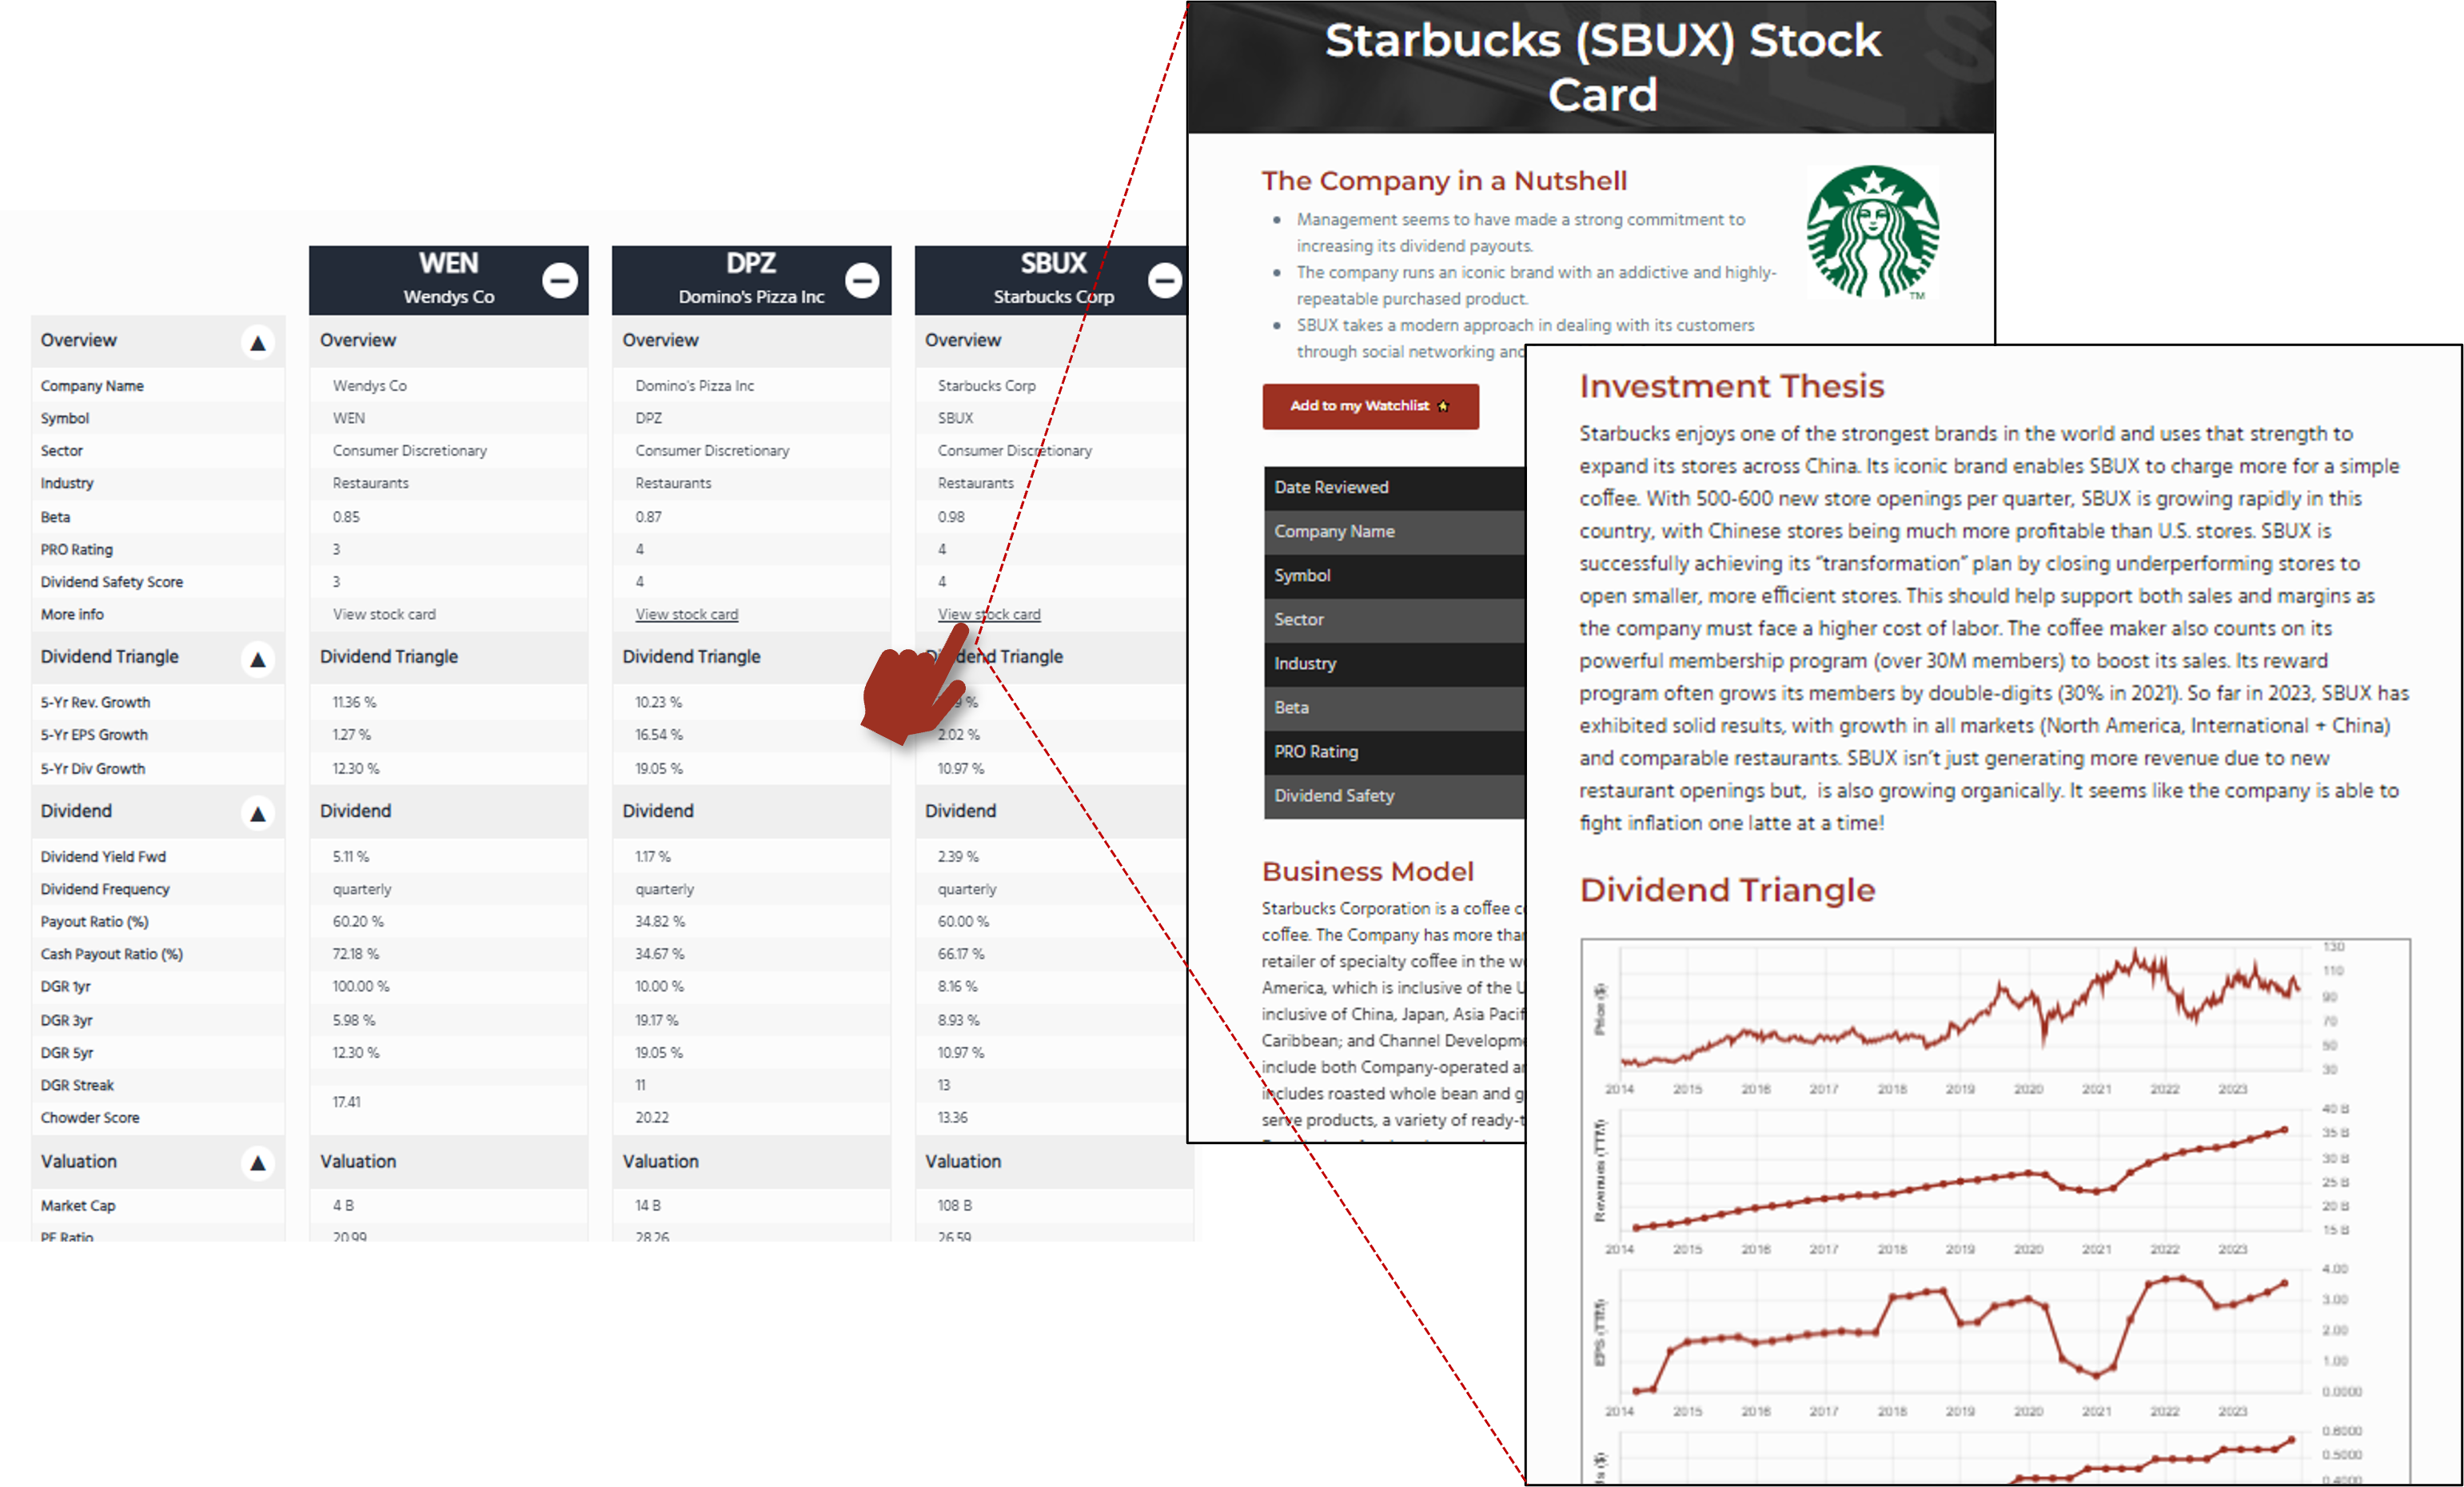
1- Business model
Learn the business models of the companies to compare. What they sell and how they make money, with repetitive sales, subscription model, sticky business? How they grow their business: organically, by acquisition? What’s the size of the companies, their geographical reach? Learn enough to explain the business model using words a twelve-year-old would understand.
Identify the similarities and differences between each company’s model to gain an understanding of how each will react or be affected by economic events.
2- Dividend triangle
The dividend triangle consists of the growth of a company’s revenue, earnings per share (EPS), and dividend payment. Review the growth trend of these three numbers over the last five years for each company. A trend of consistent growth is a good sign. Double-digit growth is strong, high-single digit is also very good.
Below, we see two dividend triangles with impressive double-digit growth over five years, but triangle 1 shows much lower growth for EPS; perhaps the margins are under pressure; the portion of the graph in the dotted rectangle shows the five-year trends for triangle 1.
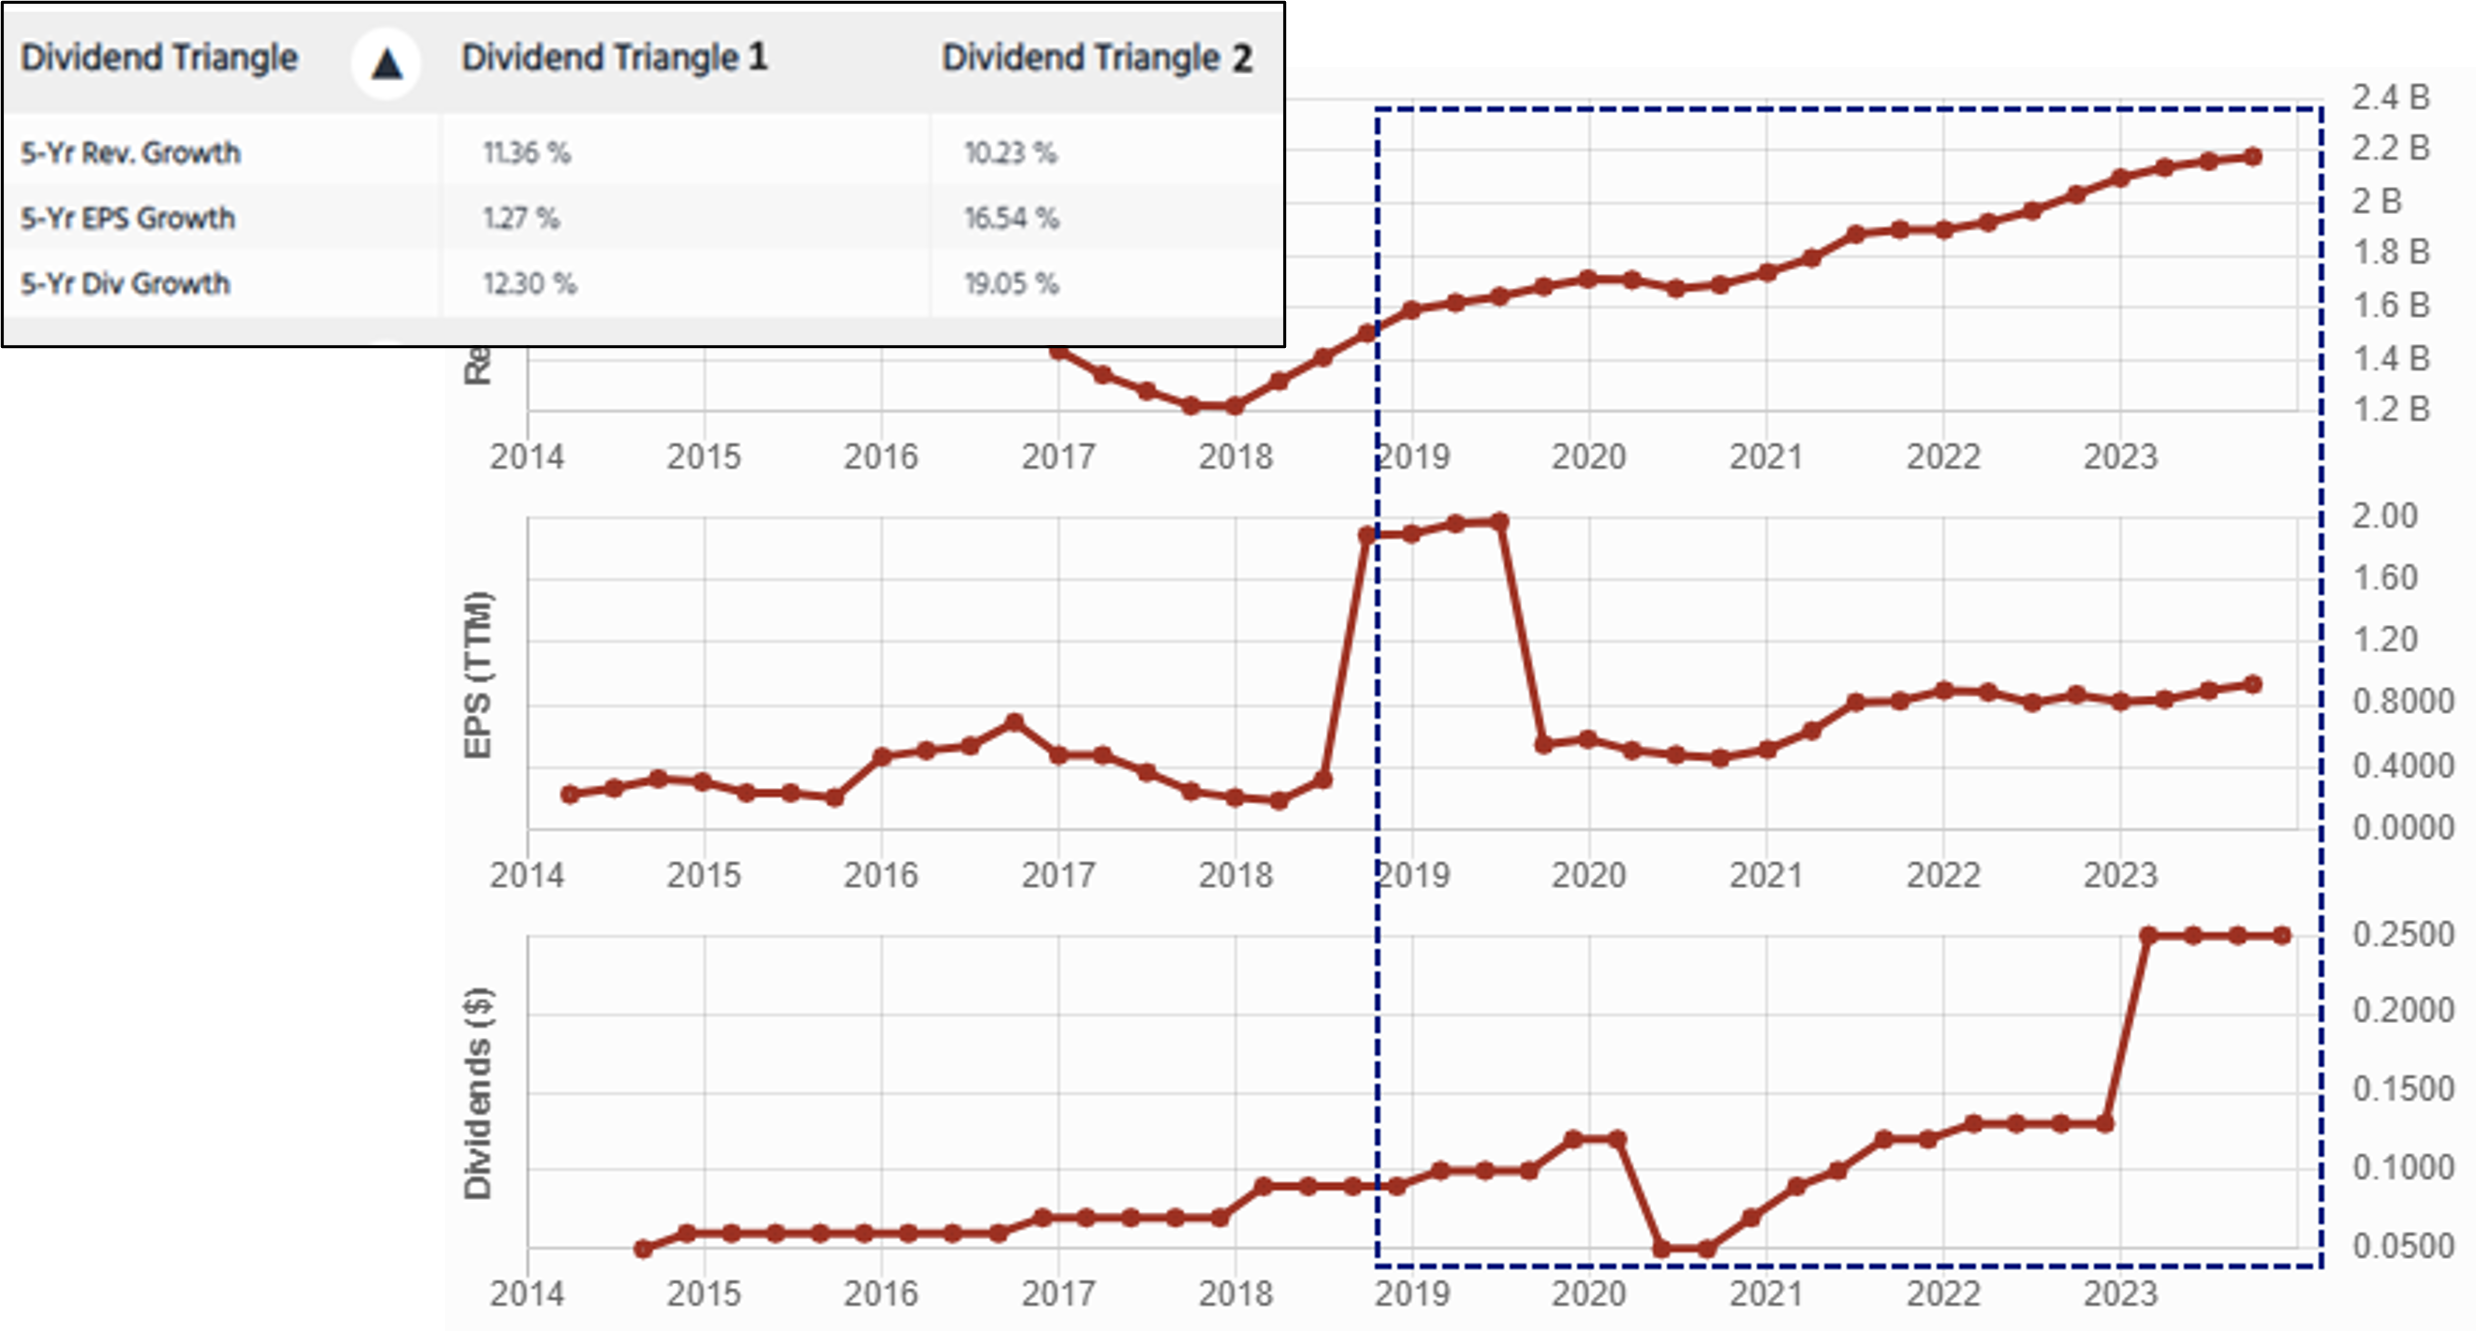
The dividend triangle gives a hint as to which companies you might want to weed out from your selection. It also pinpoints things to investigate further, for example, why is that EPS growth so much lower than revenue growth?
If one of the companies shows much weak numbers than the others, you could disregard it immediately and continue with the remaining candidates.
3- Growth factors
Now, go back to the narrative. Using the information sources mentioned earlier, find out if the companies with stellar results and growth over the last five years are likely to do the same for the next five. We invest for the future, not the past.
How will they continue growing revenues, EPS, and dividend payments? Are they in an expanding or saturated market? Are they diversifying their business or expanding geographically?
4- Dividend metrics
Time to compare the companies’ dividend metrics.
- Yield – The yield is important to some types of investors; income-seeking investors will probably discard a stock with a very low yield. Dividend growth investors won’t necessarily mind a low yield, as long as there’s consistent growth.
- Payout ratio – Shows how much of the profits the company pays out in dividend. Low payout and cash payout ratios can signal the company keeps a lot of its profit to fuel future growth rather than pay dividends. Higher payout ratios can indicate a mature well-established company offering stability, but modest growth.
- Dividend growth – Compare the annualized dividend growth over one, three, and five years of each company. Dividend growth is essential for your dividend income to at least cover inflation. A growing dividend is often linked to a company that’s doing well and that is confident about its future.
Learn how to make the most of each sector. Download our Recession-proof portfolio workbook
5- Risk evaluation
Next, compare the risks of each company.
Valuation
- Market cap: Starbuck’s cap of $108B dwarfs Wendy’s cap of $4B. Because of its size, Starbucks has easier access to financial resources; it could offer more stability, geographic reach, etc.
- PE ratio: shows how the market sees a company. A higher ratio indicates the market is willing to pay a premium for the stock. This can be reasonable if the company’s growth surge continues; or, it’s overpriced, and the stock price will drop after one or a few weak quarters.
- Compare each company’s Fwd PE ratio to its 5-year average PE ratio. A Fwd PE below the 5-year average shows less enthusiasm for the company than in the past; sometimes, it’s a good time to invest.
Debt
- Compare the credit score; the higher the better, up to 100.
- Compare the debt ratios: Debt/Equity, Financial Debt/EBITDA, and Current ratio to see if companies have a heavy debt load. Learn about debt ratios here.
Look for bearish outlook
With just a few contenders remaining on your list, it’s time to challenge your interest in them. Read what others think could go wrong. Find podcasts, YouTube videos, or articles that explain their negative outlook for each company.
Making the final choice
You’re done! Perhaps you’re left with a choice between two very good stocks. The final decision might depend on your preferences or what you want: high growth, stability, income, a company with more exposure to international markets, etc. You did your homework and considered both narrative and numbers. Whatever choice you make, you’ll be confident in it.
The post How to Compare Stocks appeared first on Dividend Monk.
Source: https://www.dividendmonk.com/how-to-compare-stocks/
Anyone can join.
Anyone can contribute.
Anyone can become informed about their world.
"United We Stand" Click Here To Create Your Personal Citizen Journalist Account Today, Be Sure To Invite Your Friends.
Please Help Support BeforeitsNews by trying our Natural Health Products below!
Order by Phone at 888-809-8385 or online at https://mitocopper.com M - F 9am to 5pm EST
Order by Phone at 866-388-7003 or online at https://www.herbanomic.com M - F 9am to 5pm EST
Order by Phone at 866-388-7003 or online at https://www.herbanomics.com M - F 9am to 5pm EST
Humic & Fulvic Trace Minerals Complex - Nature's most important supplement! Vivid Dreams again!
HNEX HydroNano EXtracellular Water - Improve immune system health and reduce inflammation.
Ultimate Clinical Potency Curcumin - Natural pain relief, reduce inflammation and so much more.
MitoCopper - Bioavailable Copper destroys pathogens and gives you more energy. (See Blood Video)
Oxy Powder - Natural Colon Cleanser! Cleans out toxic buildup with oxygen!
Nascent Iodine - Promotes detoxification, mental focus and thyroid health.
Smart Meter Cover - Reduces Smart Meter radiation by 96%! (See Video).


| Online: | |
| Visits: | 1,605,414,826 |
| Stories: | 8,156,216 |
Whistler Blowers, Insiders
