
Congress must address the transit productivity crisis

Testimony before the U.S. House of Representatives Subcommittee on Highways and Transit of the Committee on Transportation and Infrastructure in its hearing on “Revenue, Ridership, and Post-Pandemic Lessons in Public Transit.”
Chairman Crawford, Ranking Member Norton, and Members of the Subcommittee, thank you for the opportunity to testify before you today. My name is Marc Scribner. I am a senior transportation policy analyst at Reason Foundation, a national 501(c)(3) public policy research and education organization with expertise across a range of policy areas, including transportation.
For nearly half a century, Reason Foundation has conducted research on urban transportation improvements enabled by innovative procurement methods, management practices, and technologies. My testimony surveys transit productivity trends prior to the pandemic, examines the impact of the pandemic on travel behavior and transit systems, and discusses potential strategies for increasing the efficiency of transit operations.
I. Pre-Pandemic Transit Productivity
Public transit ridership in the United States cratered during the COVID-19 pandemic and, as of the first quarter of 2024, has only been able to recover 76.2% of its 2019 riders. At the same time, operating expenditures have significantly increased, which has led to growing concerns about the viability of transit systems nationwide.
However, declining transit productivity is not a new phenomenon. Transit productivity has been declining since the Urban Mass Transportation Act (UMTA) of 1964, when Congress first authorized federal funding for state and local governments to take over ailing private transit companies. Initially, federal subsidies focused on capital improvements. At the time, customer fares were able to cover operating costs but not equipment and infrastructure refurbishment and replacement. As a result, transit capital stock was rapidly depreciating. One popular theory held that modernizing transit vehicles and facilities with new capital subsidies would bring customers back to transit.
This theory misdiagnosed the principal causes of transit’s structural decline: rising household incomes, increasing private automobile ownership, and the dispersal of urban households and then workplaces into the suburbs. Increasingly, metropolitan area residents were residing in the suburbs and commuting to jobs also in the suburbs, travel patterns poorly served by transit. These changes led to a 60% decline in ridership from 1945 to 1960. While federal capital subsidies authorized by UMTA were able to slow the ridership decline, they failed to attract customers back to transit who had already left.
These dynamics led to substantial declines in transit productivity. In the 15 years prior to UMTA, transit productivity fell an average of 1.4% per year (measured in bus hours/real dollars) across all transit systems and 1.3% for large systems. Between 1964 and 1972, productivity declines averaged 2.1% per year for all systems and 3.1% for large systems.
In 1975, the federal government began subsidizing transit operations as well as capital expenditures. State and local transit subsidies were also increasing. Between 1975 and 1985, transit productivity declines averaged 3.1% per year for all systems and 3.8% for large systems.
Transit system size was found to be correlated with the rate of productivity decline. This finding has been attributed to the fact that large systems tended to serve more transit-dependent populations, giving agency management a stronger incentive to prioritize labor peace (through more generous collective bargaining agreements) over cost containment. As a result, the cumulative decline in transit productivity for large systems between 1964 and 1985 was twice as large as the decline experienced by small systems.
By 1980, just five years after Congress expanded federal funding eligibility to operating expenses, operating grants accounted for 30% of total federal transit funding. Lawmakers and transportation researchers expressed growing alarm about rising transit subsidies and their inability to stimulate ridership growth. In the 1980s, empirical research on the efficiency impacts of transit operating subsidies in the United States found:
- Federal subsidies had three times the negative effect on transit productivity as state and local subsidies.
- Nearly all operating subsidies were absorbed by rapidly growing operating expenses rather than stimulating demand for transit service.
- Both public ownership of transit systems and increasing subsidies to these systems encouraged wasteful expenditures.
While a small number of studies arrived at contrary findings, there came to be “a general consensus that subsidies have had a degrading effect on system efficiency and productivity and have increased operating costs,” although the impacts varied by subsidy source and transit system characteristics. In 1998, Congress largely eliminated federal operating subsidies for transit agencies serving urbanized areas with populations of 200,000 residents or more (although maintenance was recategorized as a capital expense).
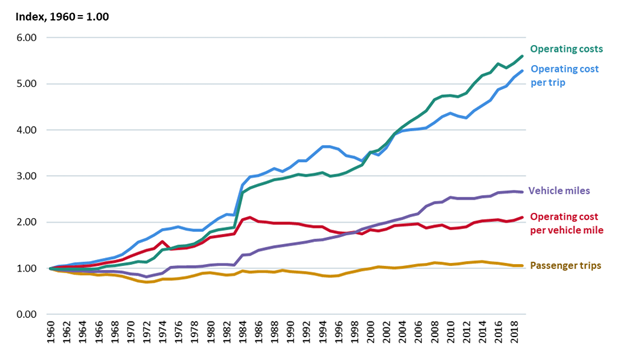
Unfortunately, changes in subsidy policy did little to address the long-term decline in U.S. transit productivity. As Figure 1 from the Congressional Research Service shows, from 1960 to 2019, the inflation-adjusted operating costs more than quintupled while ridership largely remained constant.
Figure 1: Measures of Productivity in Public Transportation, 1960–2019
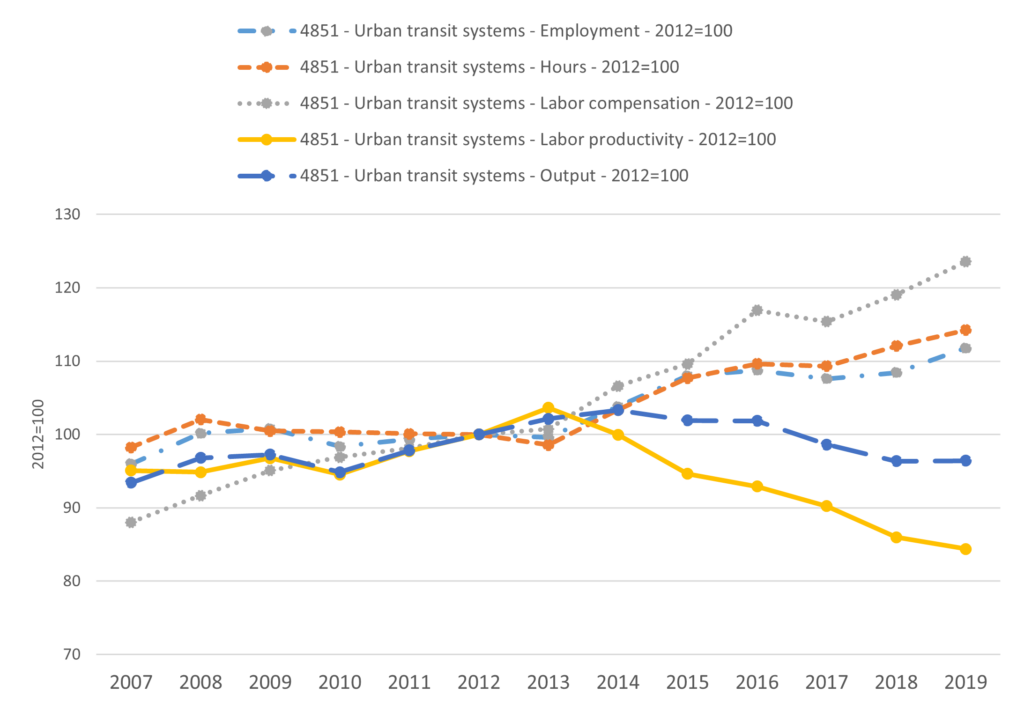
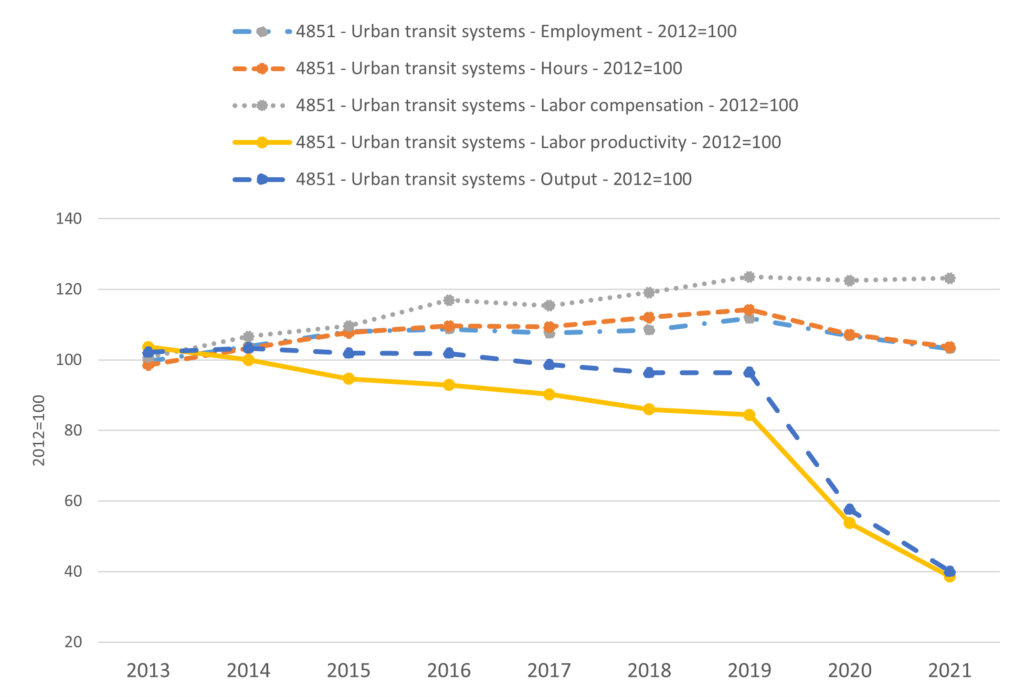
Since 2018, the Bureau of Labor Statistics has published measures of urban transit labor productivity. Labor productivity is calculated by dividing an index of output (passenger-miles traveled) by an index of hours worked. Figure 2 displays transit productivity trends in the 13 years leading up to the COVID-19 pandemic. Labor productivity between 2007 and 2013 was slightly positive, increasing at an average rate of 1.4% per year. Output over this period increased at an average rate of 1.5% per year. However, between 2013 and 2019, labor productivity declined.
One important takeaway is that the 2013–2019 decline in transit labor productivity can mostly be explained by increases in transit agency employment. Ridership during this period decreased by an average rate of 1% per year while transit work hours increased at an average rate of 2.5% per year. Hours worked per employee remained relatively constant, meaning new hires were responsible for the additional work hours and thus most of the decline in labor productivity. And as Figure 2 shows, labor compensation increased at an even faster rate during this period.
Figure 2: Transit Industry Labor Productivity Trends, 2007–2019
II. Pandemic Impacts on Travel Behavior and Transit Systems
The onset of the COVID-19 pandemic led to large declines in transit ridership. While nationwide ridership has since partially recovered from its nadir, it remains significantly depressed at 76.2% of the pre-pandemic ridership level as of the first quarter of 2024.
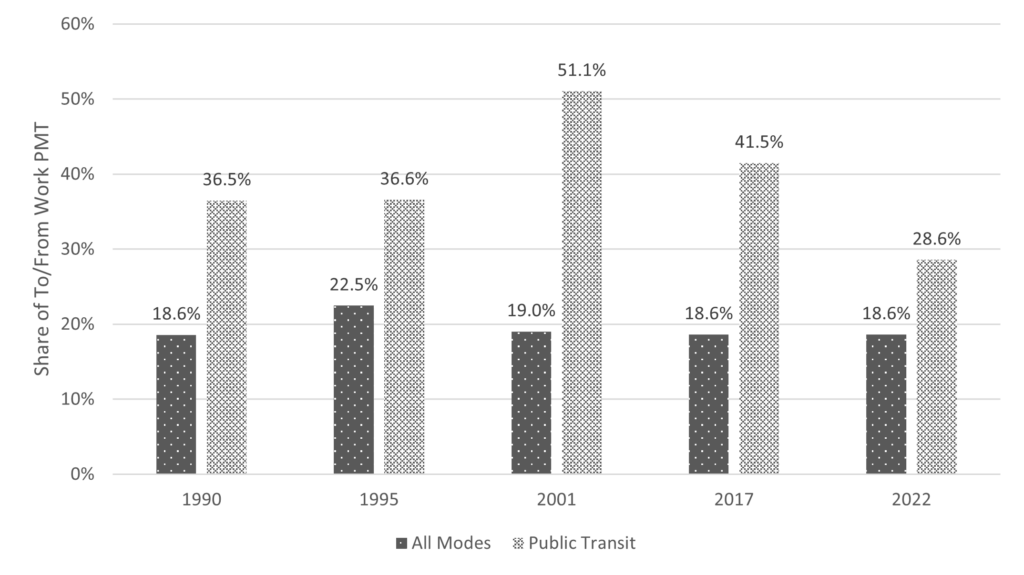
Transit systems were largely designed to serve peak-hour weekday commuting travel. Figure 3 displays data compiled from the Federal Highway Administration’s National Household Travel Survey on commuting travel’s share of total personal travel from 1990 to 2022. As it shows, commuting to and from work accounted for approximately one-fifth of personal travel (all modes) through that time period. Commuting accounted for one-third to one-half of travel by transit prior to the pandemic. Following the pandemic, commuting diminished significantly as a share of travel by transit.
Figure 3: Travel to and from Work as a Share of Personal Travel, 1990–2022
Much of this decline in transit commuting travel can be attributed to dramatic increases in working at home. In 2019, the Census Bureau’s American Community Survey estimated 5% of U.S. workers rode transit to and from work. In 2022, transit’s commuting mode share had decreased to 3.1%. In contrast, working from home increased from 5.7% in 2019 to 15.2% in 2022.
Due to the design of the American Community Survey, this likely significantly underestimates working from home because it poorly captures hybrid work schedules where workers split their work time between their workplaces and homes. The latest results from the Survey of Working Arrangements and Attitudes estimate that 27% of paid days in the U.S. in May 2024 were work-from-home days. The upshot is remote work remains three to five times its pre-pandemic share of “commuting”—and five to nine times the share of mass transit commuting.
In the face of this large decline in transit ridership, which is largely attributable to work travel trends, U.S. transit systems received record-setting federal subsidies. Supplemental COVID-19 appropriations during FYs 2020 and 2021 provided $69.5 billion in emergency support for transit agencies. The Infrastructure Investment and Jobs Act enacted in FY 2022 increased federal transit funding by 67% over the levels previously authorized by the FAST Act (in nominal dollars).
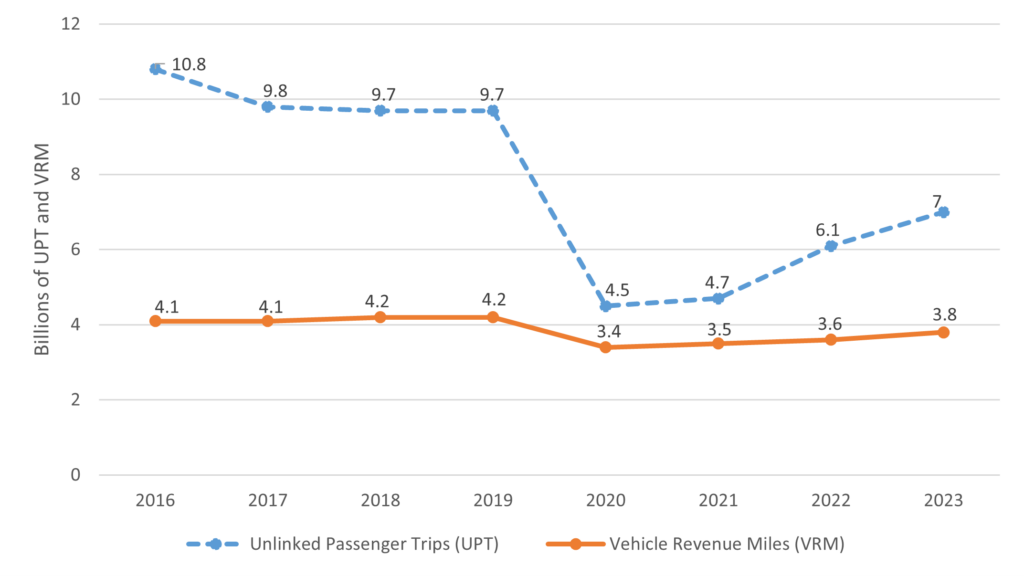
This large increase in federal funding allowed transit agencies to continue to provide service close to pre-pandemic levels. As Figure 4 shows, while transit ridership (unlinked passenger trips) decreased by 27.8% between 2019 and 2023, transit service provided (vehicle revenue miles) fell by only 9.5%.
Figure 4: Trends in Transit Ridership and Service Provision, 2016–2023
These dynamics had predictable effects on transit labor productivity. Recall, as shown in Figure 2, that the decline in transit labor productivity from 2013 to 2019 was primarily driven by increases in hours worked by new transit agency employee hires. Following the pandemic, as shown in Figure 5, the declines in labor productivity between 2019 and 2021 were almost entirely driven by decreased ridership (output in passenger-miles traveled).
Figure 5: Transit Industry Labor Productivity Trends, 2013–2021
III. Strategies for Increasing the Efficiency of Transit Operations
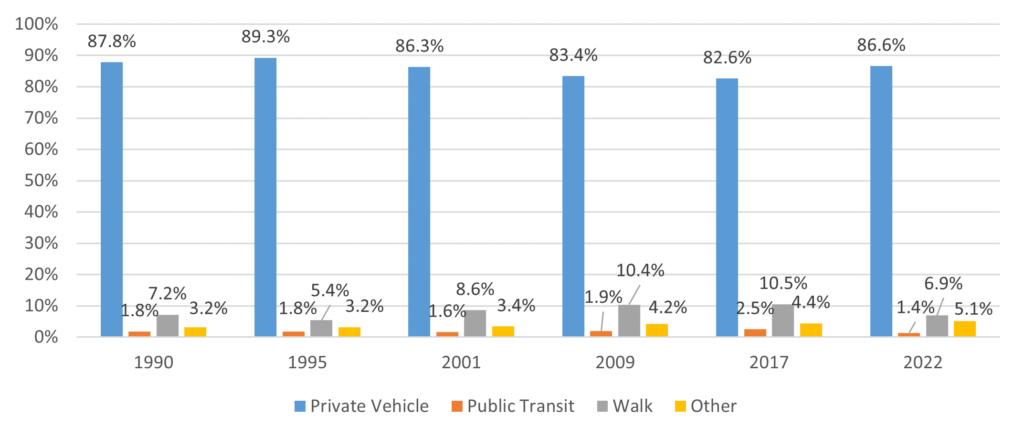
The COVID-19 pandemic amplified preexisting trends and reduced transit efficiency to the lowest levels on record. Working from home remains elevated and is likely to persist at several multiples of transit’s share of commuting. While commuting accounted for between one-third and one-half of pre-pandemic transit ridership, transit accounted for a tiny share of person trips in the United States. As Figure 6 shows, just 2.5% of person trips were made by transit in 2017, compared to 82.6% made by private vehicle. In 2022, transit’s share of person trips had fallen to 1.4% versus 86.6% of trips made by private vehicle.
Figure 6: Share of U.S. Person Trips by Mode, 1990–2022
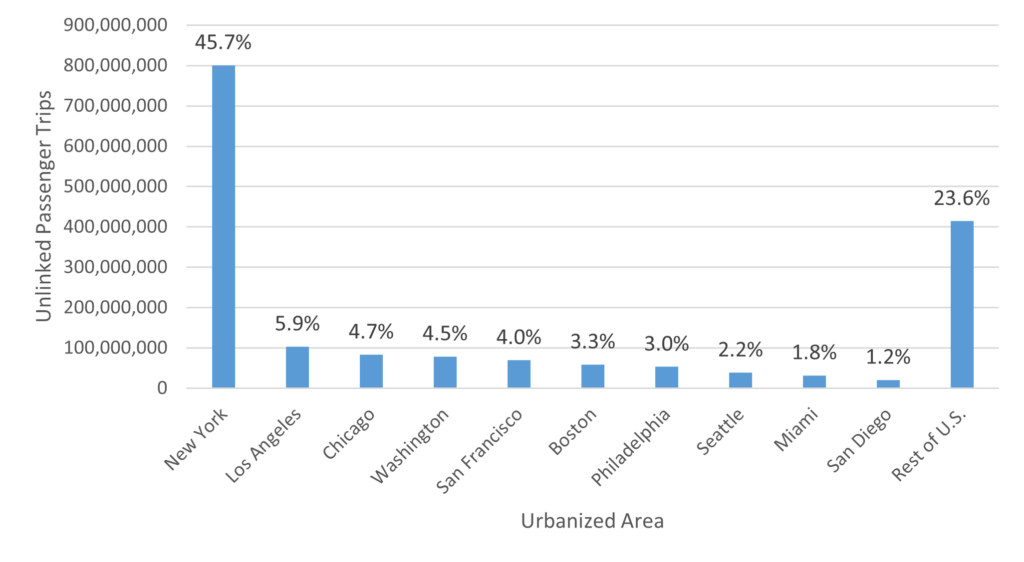
Further, U.S. transit ridership is highly concentrated in a small number of cities. As Figure 7 shows, in the first quarter of 2024, 76.4% of U.S. transit ridership took place in just 10 urbanized areas—with the New York City urbanized area alone accounting for 45.7% of nationwide transit trips.
Figure 7: Geographic Distribution of U.S. Public Transit Trips, Q1 2024
Despite transit’s status as a niche mode of passenger transportation, it is a vital service outside of New York to those who cannot afford private vehicle transportation. Recent negative trends in transit productivity are especially troubling because of the disproportionate burden that inefficient transit service imposes on low-income Americans dependent upon transit.
As historical experience with transit subsidies has shown, advancing transit efficiency is not a simple question of additional funding. Making better use of existing resources must be the priority to avoid counterproductive subsidy policies that merely deepen and prolong transit’s productivity crisis.
Transit agencies should be encouraged to experiment with operating practices that could improve system efficiency. With remote work expected to remain elevated, a number of agencies have begun rebalancing their operating schedules to de-emphasize traditional peak-hour service during the workweek to better serve their core customers.
These service adjustments may produce some benefits but are unlikely to address the steep declines in labor productivity. Two other policies show more promise to deliver substantial efficiency improvements by directly addressing labor costs, which account for approximately two-thirds of transit operating expenses.
First, competitive contracting should be encouraged. Under public-private partnerships, transit agencies can contract out transit service provision to private firms. The agency would serve as the coordinating and oversight entity, developing performance requirements and ensuring private partners adhere to those requirements embedded in their contracts. Poorly performing contractors can have their contracts terminated for cause and be replaced by a competing provider. Commuter rail and paratransit services are regularly contracted-out today.
Properly writing and enforcing service contracts could lead to substantial efficiency gains. A 2017 study published in the Journal of Public Economics estimated that contracting out bus service in the United States could reduce operating costs by 30%. Importantly, these cost savings were realized through increased labor flexibility, not cuts to service.
Second, automation of operations should be examined in longer-term capital planning. Fully automated trains are increasingly used in heavy-rail transit systems around the world and are in widespread use at U.S. airports. In addition, the Federal Transit Administration recently renewed its Strategic Transit Automation Research (STAR) Plan, which focuses on the automation of transit buses and other road vehicles.
A September 2023 report from the C2SMART university transportation research consortium compared automated and non-automated rail transit systems, finding that automated systems had operating costs 46% below non-automated systems. To put this in perspective, the authors suggest that “automation alone could generate an operational profit on the Boston T’s Red, Blue, and Orange Line, as well as the New York Subway, Philadelphia Subway, [San Francisco’s Bay Area Rapid Transit], and Caltrain,” based on pre-pandemic cost and ridership trends.
It is important to note that retrofitting existing transit rail lines for automated operations is significantly more costly than automating newly built lines from the beginning, so these estimated cost savings are too optimistic in that context. But the savings could still be very large and worth pursuing in the long term. Honolulu’s newly built Skyline elevated light-rail system is fully automated and should be closely examined in the years ahead.
While competitive contracting and automation can result in substantial savings, they will undoubtedly face opposition from labor organizations. While this opposition is understandable—if unfortunate from the taxpayer and transit-rider perspectives—it is also unjustly supported by federal law: Section 13(c).
Section 13(c) was included in the Urban Mass Transportation Act of 1964 to protect existing labor contracts as mass transit was transitioning from private to public provision. It persists to this day (49 U.S.C. § 5333(b)). As a result, in exchange for federal funding, transit agencies are required to adopt “protective arrangements” to be certified by the Department of Labor, including:
- The preservation of rights and benefits of employees under existing collective bargaining agreements;
- The continuation of collective bargaining rights;
- The protection of individual employees against a worsening of their positions in relation to their employment;
- Assurances of employment to employees of acquired transit systems;
- Assurances of priority of reemployment of employees whose employment is ended or who are laid off; and
- Paid training or retraining programs.
As a result, the mechanisms to increase transit productivity have been frozen for 60 years. While Section 13(c) as interpreted does not forbid contracting out service, it is in practice extremely challenging for agencies to contract out existing service in a cost-effective manner, especially under the sole-provider and “carryover” rights clauses contained in Section 13(c) agreements.
Likewise, automating existing transit service faces similar barriers under the labor-management relations environment distorted by Section 13(c). As a 1976 report to Congress from the Office of Technology Assessment concluded:
[Section 13(c)] allows the elimination of jobs, but only as workers presently holding those jobs retire or vacate the positions for other reasons. Thus, the economic benefits of workforce reduction through automation of an existing transit system may be deferred for a number of years until retraining, transfer, or attrition can account for the displaced workers. Alternatively, direct compensation can be paid to affected workers, eliminating the jobs earlier but at an earlier cost.
Given that deploying automation requires transit agencies to either incur substantial upfront costs to pay off affected employees or delay the realization of labor-saving benefits, transit agencies largely dependent on annual government appropriations face a strong financial disincentive to investing in automation that would improve service and reduce growing operating subsidies.
IV. Conclusion
Addressing the transit productivity crisis should be a top policy priority. Section 13(c) is designed to restrict transit management negotiating tactics, so the entire collective bargaining process is distorted to advantage labor. Given that the decline in transit productivity is driven by the divergence of labor costs and transit ridership, removing federal barriers to transit agency self-help should be prioritized before additional federal subsidies are considered.
Thank you for the opportunity to testify before the Subcommittee, and I welcome your questions.
Full testimony: Congress must address the transit productivity crisis
The post Congress must address the transit productivity crisis appeared first on Reason Foundation.
Source: https://reason.org/testimony/congress-must-address-the-transit-productivity-crisis/
Anyone can join.
Anyone can contribute.
Anyone can become informed about their world.
"United We Stand" Click Here To Create Your Personal Citizen Journalist Account Today, Be Sure To Invite Your Friends.
Humic & Fulvic Liquid Trace Mineral Complex
HerbAnomic’s Humic and Fulvic Liquid Trace Mineral Complex is a revolutionary New Humic and Fulvic Acid Complex designed to support your body at the cellular level. Our product has been thoroughly tested by an ISO/IEC Certified Lab for toxins and Heavy metals as well as for trace mineral content. We KNOW we have NO lead, arsenic, mercury, aluminum etc. in our Formula. This Humic & Fulvic Liquid Trace Mineral complex has high trace levels of naturally occurring Humic and Fulvic Acids as well as high trace levels of Zinc, Iron, Magnesium, Molybdenum, Potassium and more. There is a wide range of up to 70 trace minerals which occur naturally in our Complex at varying levels. We Choose to list the 8 substances which occur in higher trace levels on our supplement panel. We don’t claim a high number of minerals as other Humic and Fulvic Supplements do and leave you to guess which elements you’ll be getting. Order Your Humic Fulvic for Your Family by Clicking on this Link , or the Banner Below.

Our Formula is an exceptional value compared to other Humic Fulvic Minerals because...
It’s OXYGENATED
It Always Tests at 9.5+ pH
Preservative and Chemical Free
Allergen Free
Comes From a Pure, Unpolluted, Organic Source
Is an Excellent Source for Trace Minerals
Is From Whole, Prehisoric Plant Based Origin Material With Ionic Minerals and Constituents
Highly Conductive/Full of Extra Electrons
Is a Full Spectrum Complex
Our Humic and Fulvic Liquid Trace Mineral Complex has Minerals, Amino Acids, Poly Electrolytes, Phytochemicals, Polyphenols, Bioflavonoids and Trace Vitamins included with the Humic and Fulvic Acid. Our Source material is high in these constituents, where other manufacturers use inferior materials.
Try Our Humic and Fulvic Liquid Trace Mineral Complex today. Order Yours Today by Following This Link.


| Online: | |
| Visits: | 1,615,583,365 |
| Stories: | 8,186,592 |
Whistler Blowers, Insiders