

Robert Reich's CEO Pay Chart Is Wrong. Here's the Real Math.


Robert Reich, an emeritus professor at the University of California, Berkeley, and a former U.S. labor secretary, makes popular economics videos arguing that the U.S. economy is rigged against workers.
One of his recent pieces caught my eye because it makes heavy use of numbers and charts. The video is a great example of how to misuse economic data to support a preconceived narrative—in this case, a fairy-tale account of evil CEOs stealing wealth from their employees.
At the outset of the video, Reich presents a chart showing that in 2024 the “typical worker” earned $36.49 per hour, while CEOs made—”ready for this?” Reich asks viewers—$431.80!
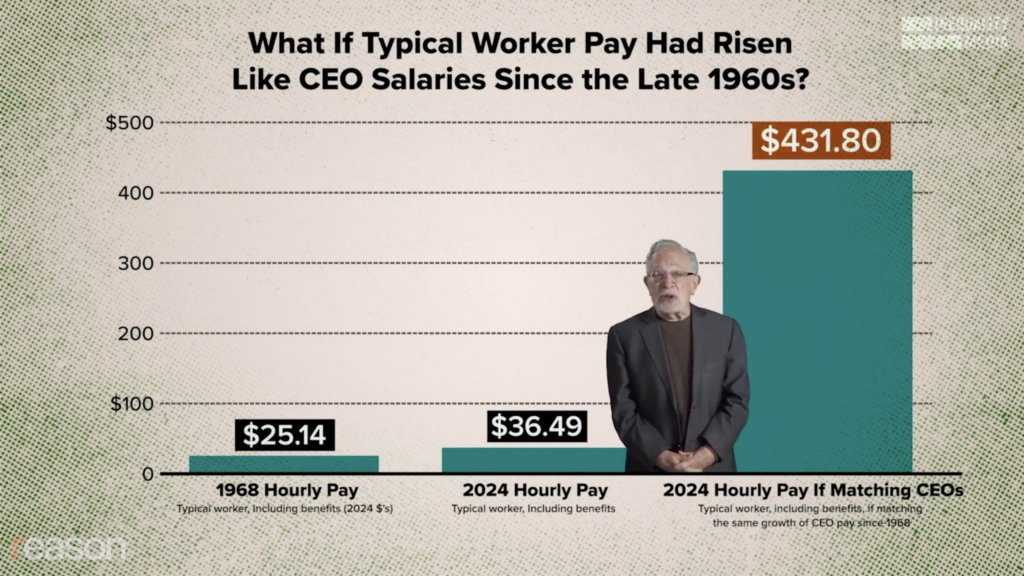
There are lots of problems with this chart, starting with the fact that it’s labeled “CEO Salaries,” but that’s not what the $431.80 figure represents. Though he rarely sources his work, Reich’s chart matches data from a report by the Economic Policy Institute (EPI), which measures what the leaders of the largest 350 public corporations in America earn, not all CEOs.
There are about 4,000 publicly traded corporations headquartered in the U.S., and even more privately held companies. They all have CEOs. Reich has cherry-picked the wealthiest and most successful faces in the crowd. This is like measuring what the highest-paid actors earn, setting aside all the struggling performers waiting tables, and claiming that acting is the world’s most lucrative profession.
If you broaden the lens to include CEOs at ordinary-sized companies, Bureau of Labor Statistics (BLS) data show their pay looks a lot like that of other professionals: Median CEOs make about $200,000 a year, and their pay is growing at about the same pace as everyone else’s.
Another problem is that the $431.80 is compensation realized in 2024. Most of it came from stock options granted for performance in previous years. In the prior five years, stock prices had roughly doubled, allowing CEOs to cash in compensation from past years. It’s a lot of money, but perhaps not out of proportion to five years of service steering the world’s largest and most successful businesses through the pandemic and doubling shareholder wealth. And only the CEOs who survived the turmoil and delivered the doublings were around to collect it. In a down year for the stock market, you might see compensation drop by 80 percent.
The CEOs of the largest American companies have seen their compensation grow at an extraordinary pace, but that’s because the businesses they run have grown so large. A highly regarded paper by economists Xavier Gabaix and Augustin Landier, “Why Has CEO Pay Increased So Much?” showed that CEO compensation should scale with firm size, and that this effect explains the entire rise in CEO pay.
Today, Nvidia’s market cap alone is more than two and a half times the entire S&P 500′s market cap when it was created in 1957, adjusted for inflation. Comparing CEO pay at the largest firms in 1968 vs. what they make today is like equating the director of a late-night commercial for a personal injury law firm to the director of a Hollywood blockbuster. Nvidia CEO Jensen Huang impacts more economic value in an afternoon in 2026 than James Roche did as the CEO of General Motors in all of 1968.
The same compensation explosion has occurred across every winner-take-all field, affecting top athletes, movie stars, and best-selling authors. The highest NBA salary in 1968 was Wilt Chamberlain’s $250,000-a-year deal with the Lakers, and the team also agreed to cover his taxes. Chamberlain’s salary alone works out to roughly $2.2 million in today’s dollars. Compare that to Steph Curry’s record-setting $62.6 million pay package in the upcoming NBA season.
Yet Reich claims that “the system is rigged.” Is the NBA also rigged in favor of Curry? Against whom?
Reich has more evidence that the economy is rigged against workers. He presents another chart showing, in his words, that “big corporations chronically underpay workers compared to the workers’ productivity on the job. Productivity, that is, the value of their output, has soared and resulted in record corporate profits.”
The source of Reich’s chart, which shows the productivity-pay gap, was once again the EPI, which compares workers’ earnings over time to the productivity of the U.S. economy.
The measure they used for worker pay doesn’t include all employees. It’s just “nonsupervisory workers,” so it excludes management. The EPI says that it uses this dataset because it represents “the typical worker,” or “roughly 80% of the U.S. workforce.” The purpose of the chart, they explain, is to answer “a crucial question: Do typical workers in the United States share in the benefits of economic growth?”
The problem is that the EPI is drawing on an untrustworthy dataset. In 2005, the BLS published a note in the Federal Register repudiating its measure of nonsupervisory workers’ earnings, stating that it had “limited value.”
The agency also noted that the distinction between a “supervisory” and “nonsupervisory worker” was “not meaningful to survey respondents” and “that it is not possible to tabulate their payroll records” to reflect this distinction.
In 2003, Patricia Getz, who was in charge of employment statistics at the BLS, noted that “records are not kept for these groupings of workers,” so employers weren’t filling out this portion of the survey.
And this series only counts regular paychecks. Bonuses, profit sharing, and stock grants, which represent how a growing share of American workers are paid over the exact period this chart covers, are excluded entirely.
The BLS sought to discontinue this data series altogether in favor of the all-employee series. In the end, it continued to collect and publish data on nonsupervisory workers, but the poor data quality renders this chart essentially worthless.
The wage measure favored by the BLS tracks compensation for all employees at all levels, not only because this is a more trustworthy dataset, but on the logical assumption that a company’s gains in productivity reflect the combined efforts of all employees, including its officers and supervisors.
Reich also cites gross productivity before depreciation. Consider an Uber driver whose passengers pay $85,000 over a year, of which $30,000 goes toward expenses such as gas, insurance, and fees. The driver’s gross productivity is $55,000. But her car might have depreciated $15,000, so the net productivity is $40,000. That $15,000 wasn’t stolen from her paycheck by a greedy CEO; it’s a true loss in economic value.
This matters because over the period Reich discusses, corporate assets shifted from slow-depreciation assets such as steel mills to faster-depreciating assets such as computers and software. Depreciation has risen from 12 percent of national income to 17 percent. Reich is counting that 5 percent difference as stolen from workers, but in fact, it disappeared.
Regardless, if we use the data favored by the BLS and compare all worker compensation to productivity, the divergence between pay and productivity disappears.
Reich’s theory that workers are getting shafted has a third component: He claims that CEOs are “siphoning” profits into stock buybacks to boost their own compensation.
“Stock buybacks,” he claims, “reduce the number of shares available for investors to purchase, which drives up the value of the remaining shares. Just simple supply and demand.”
This is an elementary accounting error. Take a $10 billion market-cap company with 100 million shares trading at $100 each. It decides to do a 10 percent buyback, spending $1 billion to buy 10 million shares for $100 each. The $1 billion cash it spends makes it a $9 billion company. It now has 90 million shares outstanding. The stock price is the same $100 per share outstanding.
Of course, in real life, things are not so neat. Investors tend to take a buyback announcement as good news; the insiders think the stock is undervalued, and bid the price up a few percent. There are other cases where investors take the opposite view: The buyback is a sign the company has no better use of its cash and is fading. But the point is it’s not “simple supply and demand”; it’s a signal that might or might not help the stock price.
Moreover, Reich misunderstands the purpose of a stock buyback. Companies have two ways of transferring profits to their shareholders: They can pay a dividend or they can do a buyback. The economic effect is the same.
Reich sees buybacks as a way of diverting profits to themselves rather than sharing them with their workers. “Corporations and their CEOs are instead siphoning them off into stock buybacks,” he says.
They’re not “siphoning” money. They’re paying out profits to their owners. All investors, even greedy ones, are entitled to a share of the earnings of the companies they own. That’s the deal. And without it, nobody would invest in the first place.
“Stock buybacks used to be considered illegal stock manipulation until Ronald Reagan came along,” Reich says. “CEOs can now effectively give themselves a raise while workers get the shaft.”
Stock buybacks were never “considered illegal stock manipulation.” In 1982, the SEC clarified a gray area, simplifying the legal treatment of stock buybacks and making it easier for companies to use them as an alternative to paying dividends.
Reich claims that stock buybacks are worse than paying dividends because they’re a way for CEOs to enrich themselves. “These rising share prices bump up CEO pay because increasingly part of their compensation is in shares of stock,” he says.
The problem with this theory is that boards of directors, not CEOs, decide whether to pursue stock buybacks. These are the same directors who negotiate CEO compensation. Buybacks are an item on the negotiation checklist, like benefits and contract length, not something CEOs sneak in afterward to inflate their earnings.
What’s the evidence on how buybacks affect CEO compensation? A study in the Journal of Accounting and Economics found the relationship between buybacks and CEO compensation was spurious. Research by a compensation consulting firm that examined S&P 500 buybacks from 2018 to 2021 found the same picture from inside the boardroom: Pay packages rest on multiple performance metrics, and the companies making the largest buybacks adjust their incentive targets to cancel out the share-count effect.
So what does Reich conclude from all of this misinformation and misconceived data? That we need a slew of policies to rein in American capitalism. He says we should “raise the federal minimum wage,” “strengthen labor unions,” “use antitrust laws to break up big corporate monopolies,” “raise taxes on corporations,” and “ban stock buybacks.”
Apart from his misinformed discussion of stock buybacks, Reich doesn’t address those issues in his video. Instead, all he’s done is cherry-pick the compensation of the top CEOs in America and use a faulty data series to claim the economy is rigged against workers.
The charts and numbers we use to argue about important questions in public life are too often presented in deceptive ways. It doesn’t get much more deceptive than this video.
To keep up with our video series Wrong Number featuring Aaron Brown, and to receive bonus content and more, click here to enter your email address. By joining our list, you’ll also have a chance to win a copy of Brown’s new book, Wrong Number: How to Extract Truth From a Blizzard of Quantitative Disinformation.
The post Robert Reich’s CEO Pay Chart Is Wrong. Here’s the Real Math. appeared first on Reason.com.
Source: https://reason.com/video/2026/07/09/robert-reichs-ceo-pay-chart-is-wrong-heres-the-real-math/
Anyone can join.
Anyone can contribute.
Anyone can become informed about their world.
"United We Stand" Click Here To Create Your Personal Citizen Journalist Account Today, Be Sure To Invite Your Friends.
Before It’s News® is a community of individuals who report on what’s going on around them, from all around the world. Anyone can join. Anyone can contribute. Anyone can become informed about their world. "United We Stand" Click Here To Create Your Personal Citizen Journalist Account Today, Be Sure To Invite Your Friends.
LION'S MANE PRODUCT
Try Our Lion’s Mane WHOLE MIND Nootropic Blend 60 Capsules
Mushrooms are having a moment. One fabulous fungus in particular, lion’s mane, may help improve memory, depression and anxiety symptoms. They are also an excellent source of nutrients that show promise as a therapy for dementia, and other neurodegenerative diseases. If you’re living with anxiety or depression, you may be curious about all the therapy options out there — including the natural ones.Our Lion’s Mane WHOLE MIND Nootropic Blend has been formulated to utilize the potency of Lion’s mane but also include the benefits of four other Highly Beneficial Mushrooms. Synergistically, they work together to Build your health through improving cognitive function and immunity regardless of your age. Our Nootropic not only improves your Cognitive Function and Activates your Immune System, but it benefits growth of Essential Gut Flora, further enhancing your Vitality.

Our Formula includes: Lion’s Mane Mushrooms which Increase Brain Power through nerve growth, lessen anxiety, reduce depression, and improve concentration. Its an excellent adaptogen, promotes sleep and improves immunity. Shiitake Mushrooms which Fight cancer cells and infectious disease, boost the immune system, promotes brain function, and serves as a source of B vitamins. Maitake Mushrooms which regulate blood sugar levels of diabetics, reduce hypertension and boosts the immune system. Reishi Mushrooms which Fight inflammation, liver disease, fatigue, tumor growth and cancer. They Improve skin disorders and soothes digestive problems, stomach ulcers and leaky gut syndrome. Chaga Mushrooms which have anti-aging effects, boost immune function, improve stamina and athletic performance, even act as a natural aphrodisiac, fighting diabetes and improving liver function. Try Our Lion’s Mane WHOLE MIND Nootropic Blend 60 Capsules Today. Be 100% Satisfied or Receive a Full Money Back Guarantee. Order Yours Today by Following This Link.


| Visits: | 1,828,348,624 |
| Stories: | 8,685,888 |
Whistler Blowers, Insiders

