
Visualizing Europe’s GDP-Per-Capita By Country

Europe is home to some of the largest and most sophisticated economies in the world. But how do countries in the region compare with each other on a per capita productivity basis?
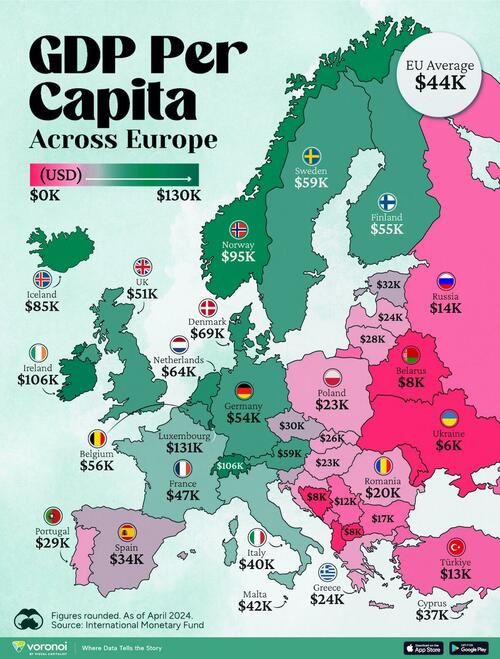
In this map, Visual Capitalist’s Pallavi Rao shows Europe’s GDP per capita levels across 44 nations in current U.S. dollars.
Data for this visualization and article is sourced from the International Monetary Fund (IMF) via their DataMapper tool, updated April 2024.
Europe’s Richest and Poorest Nations, By GDP Per Capita
Luxembourg, Ireland, and Switzerland, lead the list of Europe’s richest nations by GDP per capita, all above $100,000.
| Rank | Country | GDP Per Capita (2024) |
|---|---|---|
| 1 |  Luxembourg Luxembourg |
$131,380 |
| 2 |  Ireland Ireland |
$106,060 |
| 3 |  Switzerland Switzerland |
$105,670 |
| 4 |  Norway Norway |
$94,660 |
| 5 |  Iceland Iceland |
$84,590 |
| 6 |  Denmark Denmark |
$68,900 |
| 7 |  Netherlands Netherlands |
$63,750 |
| 8 |  San Marino San Marino |
$59,410 |
| 9 |  Austria Austria |
$59,230 |
| 10 |  Sweden Sweden |
$58,530 |
| 11 |  Belgium Belgium |
$55,540 |
| 12 |  Finland Finland |
$55,130 |
| 13 |  Germany Germany |
$54,290 |
| 14 |  UK UK |
$51,070 |
| 15 |  France France |
$47,360 |
| 16 |  Andorra Andorra |
$44,900 |
| 17 |  Malta Malta |
$41,740 |
| 18 |  Italy Italy |
$39,580 |
| 19 |  Cyprus Cyprus |
$37,150 |
| 20 |  Spain Spain |
$34,050 |
| 21 |  Slovenia Slovenia |
$34,030 |
| 22 |  Estonia Estonia |
$31,850 |
| 23 |  Czech Republic Czech Republic |
$29,800 |
| 24 |  Portugal Portugal |
$28,970 |
| 25 |  Lithuania Lithuania |
$28,410 |
| 26 |  Slovakia Slovakia |
$25,930 |
| 27 |  Latvia Latvia |
$24,190 |
| 28 |  Greece Greece |
$23,970 |
| 29 |  Hungary Hungary |
$23,320 |
| 30 |  Poland Poland |
$23,010 |
| 31 |  Croatia Croatia |
$22,970 |
| 32 |  Romania Romania |
$19,530 |
| 33 |  Bulgaria Bulgaria |
$16,940 |
| 34 |  Russia Russia |
$14,390 |
| 35 |  Türkiye Türkiye |
$12,760 |
| 36 |  Montenegro Montenegro |
$12,650 |
| 37 |  Serbia Serbia |
$12,380 |
| 38 |  Albania Albania |
$8,920 |
| 39 |  Bosnia & Herzegovina Bosnia & Herzegovina |
$8,420 |
| 40 |  North Macedonia North Macedonia |
$7,690 |
| 41 |  Belarus Belarus |
$7,560 |
| 42 |  Moldova Moldova |
$7,490 |
| 43 |  Kosovo Kosovo |
$6,390 |
| 44 |  Ukraine Ukraine |
$5,660 |
| N/A |  EU Average EU Average |
$44,200 |
Note: Figures are rounded.
Three Nordic countries (Norway, Iceland, Denmark) also place highly, between $70,000-90,000. Other Nordic peers, Sweden and Finland rank just outside the top 10, between $55,000-60,000.
Meanwhile, Europe’s biggest economies in absolute terms, Germany, UK, and France, rank closer to the middle of the top 20, with GDP per capitas around $50,000.
Finally, at the end of the scale, Eastern Europe as a whole tends to have much lower per capita GDPs. In that group, Ukraine ranks last, at $5,660.
A Closer Look at Ukraine
For a broader comparison, Ukraine’s per capita GDP is similar to Iran ($5,310), El Salvador ($5,540), and Guatemala ($5,680).
According to experts, Ukraine’s economy has historically underperformed to expectations. After the fall of the Berlin Wall, the economy contracted for five straight years. Its transition to a Western, liberalized economic structure was overshadowed by widespread corruption, a limited taxpool, and few revenue sources.
Politically, its transformation from authoritarian regime to civil democracy has proved difficult, especially when it comes to institution building.
Finally, after the 2022 invasion of the country, Ukraine’s GDP contracted by 30% in a single year—the largest loss since independence. Large scale emigration—to the tune of six million refugees—is also playing a role.
Despite these challenges, the country’s economic growth has somewhat stabilized while fighting continues.
Tyler Durden Fri, 05/10/2024 – 02:45
Source: https://freedombunker.com/2024/05/09/visualizing-europes-gdp-per-capita-by-country/
Anyone can join.
Anyone can contribute.
Anyone can become informed about their world.
"United We Stand" Click Here To Create Your Personal Citizen Journalist Account Today, Be Sure To Invite Your Friends.
Humic & Fulvic Liquid Trace Mineral Complex
HerbAnomic’s Humic and Fulvic Liquid Trace Mineral Complex is a revolutionary New Humic and Fulvic Acid Complex designed to support your body at the cellular level. Our product has been thoroughly tested by an ISO/IEC Certified Lab for toxins and Heavy metals as well as for trace mineral content. We KNOW we have NO lead, arsenic, mercury, aluminum etc. in our Formula. This Humic & Fulvic Liquid Trace Mineral complex has high trace levels of naturally occurring Humic and Fulvic Acids as well as high trace levels of Zinc, Iron, Magnesium, Molybdenum, Potassium and more. There is a wide range of up to 70 trace minerals which occur naturally in our Complex at varying levels. We Choose to list the 8 substances which occur in higher trace levels on our supplement panel. We don’t claim a high number of minerals as other Humic and Fulvic Supplements do and leave you to guess which elements you’ll be getting. Order Your Humic Fulvic for Your Family by Clicking on this Link , or the Banner Below.

Our Formula is an exceptional value compared to other Humic Fulvic Minerals because...
It’s OXYGENATED
It Always Tests at 9.5+ pH
Preservative and Chemical Free
Allergen Free
Comes From a Pure, Unpolluted, Organic Source
Is an Excellent Source for Trace Minerals
Is From Whole, Prehisoric Plant Based Origin Material With Ionic Minerals and Constituents
Highly Conductive/Full of Extra Electrons
Is a Full Spectrum Complex
Our Humic and Fulvic Liquid Trace Mineral Complex has Minerals, Amino Acids, Poly Electrolytes, Phytochemicals, Polyphenols, Bioflavonoids and Trace Vitamins included with the Humic and Fulvic Acid. Our Source material is high in these constituents, where other manufacturers use inferior materials.
Try Our Humic and Fulvic Liquid Trace Mineral Complex today. Order Yours Today by Following This Link.


| Online: | |
| Visits: | 1,612,453,894 |
| Stories: | 8,177,049 |
Whistler Blowers, Insiders
