
Fragility In A One Stock, Stock “Market”

By Peter Tchir of Academy Securities
Ok, calling this a “one stock” stock “market” seems a bit extreme, but is it? On Thursday when stocks rolled over (the Nasdaq 100 started higher at the open and then dropped almost 300 points from there), virtually everyone I spoke to pointed to NVDA shares reversing as the main weight on the overall indices. Throughout much of Thursday and Friday, I was receiving many more notes on support/resistance related to NVDA than the indices, Treasuries, or anything else that could be whipping markets around. Yes, Friday was “triple witching,” which likely added to the volatility, but there was one stock that dominated all market conversation.
I’m wondering if that is why it is so difficult to make sense of markets on many fronts? Why we seem to be getting a variety of indicators, all pointing in different directions?
Breadth, one of the topics in last week’s Same But Different, is clearly front and center in this report.
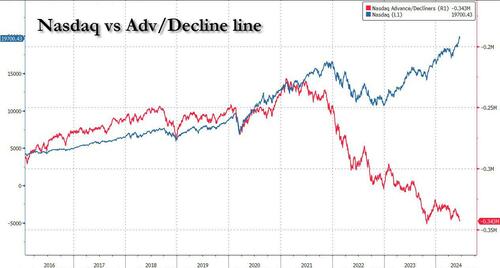
Breadth, along with the role that options are playing in the market, and a whirlwind of Geopolitical Risks, were discussed on Bloomberg TV on Tuesday (Academy’s segment starts at the 50-minute mark).
Before Jumping into the “Macro”
In case you missed it, Academy published our mid-month assessment of Geopolitical Risk – Perception vs Reality.
-
Wildcard Risk, a catch-all, rose the most. Partly because North Korea ratcheted up a notch or two on Putin’s visit (SITREP) and shots were fired along the DMZ. The escalation between China and the Philippines near the Second Thomas Shoal is also attracting our attention, as we have a Defense Treaty in place with the Philippines. This could get tricky and be very disruptive.
-
We also provided our updated views on what we see the market pricing in, versus what we think should be getting priced in for Russia, Trade Wars, the Middle East, Commodity Prices, and CYBER.
The “One Stock” Stock Market at a Glance
ETF Flows
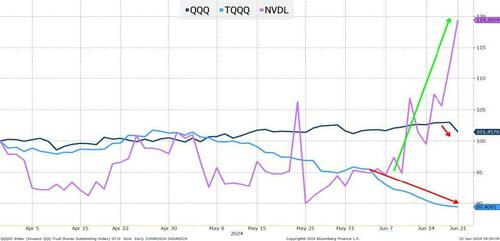
We start with 3 ETFs.
-
TQQQ, a 3x leveraged ETF on the Nasdaq 100 (with a $24 billion market cap), has been experiencing outflows for several weeks. While we didn’t include it here, SQQQ, a 3x inverse ETF on the Nasdaq 100, has been garnering some serious inflows (though only $3 billion). One way to interpret this data, is that “faster” money has been taking profits in the Nasdaq 100 and while still outright bullish (based on relative market caps), it shows signs that the market is tired.
-
QQQ is a Nasdaq 100 ETF. It is a whopping $284 billion, and I view it as a bellwether of flows from buy and hold “mom and pop” accounts, to hedge funds, to large asset managers adjusting their asset allocations. It has trickled higher in terms of flows since the start of the 2nd quarter, but had some meaningful outflows in the past few days. Again, more “trimming” than exiting risk, but an interesting development.
-
Which brings us to NVDL, an ETF that provides a 2x leveraged return on NVDA. It is $4.3 billion in size, so not big, but big enough for us to pay attention to. While investors were shedding risk in the Nasdaq 100, this ETF was getting large inflows! I still cannot understand why the regulators approve single stock ETFs of any sort (especially leveraged). There seem to be enough ways to invest in single stocks without needing an ETF. Let alone an ETF that is path dependent. The leveraged ETFs (unless a stock moves in one direction day after day) will always underperform the leveraged return of the stock from the initial investment date (it is a function of the rebalancing mechanism). Why this ETF exists, I don’t know, but it seems to give us a glimpse into the “one stock” nature of this market.
We didn’t dare include XLK (a $71 billion ETF focused on the Tech Sector) in the chart, because it would have broken the chart. Since the start of the 2nd quarter, it has experienced mild outflows (consistent with profit taking), but it had a very large inflow on Tuesday and outflow on Friday, presumably associated with the rebalancing (MarketWatch Report). Our understanding is that the rules that this ETF follows only allow for 2 stocks to be weighted above 5% (at the time of the reweighting). Currently those two stocks are MSFT and AAPL (both a little over 20%). NVDA (at 5.8%) is expected to “flip flop” with AAPL as one of the two most weighted stocks. That seems to be setting up traders. As a quick test for Bloomberg users, pull up your “favorite” ETF and go to the Current News page (CN
While we are not here to hammer on “passive,” it seems important to remember that every $100 that currently flows in or out of QQQ (for example) creates $45 of buying or selling for 7 companies (8 stocks but 7 companies as both GOOG and GOOGL are in the top 8).
The trading related to ETF inflows and outflows is robotic. There are rules that are followed (daily and on rebalancing), but in an era where so many investors prefer index-based ETFs to individual stocks or managed mutual funds, I sometimes wonder if we truly “understand” what we are getting, and the ramifications of those investments, when the indices are so heavily skewed to a few stocks (this isn’t a new issue, but has risen to the top of conversations once again).
Before finishing this section on some of the mixed signals in ETF flows and the “passivity” of these strategies, we’d be remiss not to include QQQE (a Nasdaq 100 equal weighted ETF). If you thought that investors would flock to an ETF where any “catch-up” rally will do well, you are wrong. Shares outstanding are still lower than they were last summer (when it seemed much easier to get on the “laggard” train) and the ETF is “only” $1.25 billion, a fraction of the size of NVDL despite, at least to me, being a product that gives access to something that would be difficult to replicate on your own. RSP, an S&P 500 equal weighted ETF, does have $54 billion in AUM, but has been experiencing outflows.
I’m stuck seeing too much focus on a single stock and am concerned by the nature of passive funds impacting a variety of stocks. I cannot get behind the “catch up” rally, because unlike last fall, where you could bet that the data was improving and the average stock had not responded, we’ve had the “good” data and haven’t been able to get a strong response from much of the market.
Riddle Me This – Investor Sentiment
The first two things I look to when thinking about investor sentiment are:
- The CNN Fear & Greed Index. It currently registers as “fear.” With the VIX at 13, that didn’t jump out as being an obvious place for this index to register. A month ago, the index was in “greed” mode, and I’m not really sure how it is coming up with “fear,” but I have to respect it (maybe it is picking up on some of the fund flows we’ve been seeing, which have shown reductions in risk taking). So, we have one measure saying “fear.”
- The next stop is the AAII Investor Sentiment Survey. Lo and behold, 44.4% are bullish. Higher than a month ago. Only 22.5% are bearish, far lower than a month ago. This measure is telling me “greed.”
While these two measures don’t always agree (and are generally good contrarian signals at the extremes), one is saying fear (though not at a “signal” strength), and the other is saying greed (at close to “signal” strength).
“Clear as mud” is one possible explanation. One picks up surveys where investors can’t help thinking about the broad market and the economy overall, and the other picks up “hard data” where much of that hard data is influenced by all the changes in the options markets. We didn’t even talk about the option selling based ETFs or even the heavily skewed weightings in indices. Something to explore at the very least.
Given those mixed signals, we can go back to my favorite fallback indicator – RSI. RSI (or Relative Strength Indicator) for the Nasdaq 100 is in overbought territory but has been coming down. At least this indicator makes some sense to me. Greedy, but less greedy than a few weeks ago.
Rates
The 10-year is still sitting below 4.3% (I continue to believe that 4.3% to 4.5% is the “right” range for now).
-
Inflation data is likely to continue softening, supporting Fed cut projections and helping yields across the curve.
-
European politics will add volatility. Last week, political news out of Europe seemed to help the bond market, but I’m not expecting that to be the norm.
-
Our Deficits. The CBO raised their estimates for this year’s deficit to just under $2 trillion (more than a 25% increase from earlier projections). They see no end in sight, and I believe that the debate will put the deficit in the headlights (and not in a good way) as the reality of most policies seems to be destined to increase the deficit (just doing it in different ways).
The short end of the curve should benefit from data, while the longer end of the yield curve is likely to be impacted by re-focusing on the deficit, and the debate seems like an ideal catalyst for that.
Credit
Corporate issuers had to take advantage of the drop in yields and the window to issue ahead of the potentially slow July/August period, and that pushed spreads slightly higher.
I’m still all-in on adding to credit risk, across the board, from structured, to high yield, to IG, to munis. There are some interesting charts showing that for investment grade companies, net interest expense is actually a positive. So many companies are locking in low yields and many companies are sitting on huge cash piles earning more than their cost of debt, that interest is coming into corporate America, rather than being paid out. Not sure how long that lasts, and it mostly impacts a handful of companies, but interesting, nonetheless. That is the only new thing that I would add to Credit Spreads Can Go Much Tighter.
Bottom Line
Greedy, but less greedy. It seems like not only is the “catch up” trade not gaining traction, but even the best performing areas are seeing some profit taking.
Is this a possible inflection point in the direction of flows? Have we set ourselves up to the point that momentum might waver, triggering selling in the momentum arena, which has been a great factor to chase this year? If so, does the weighting of a handful of stocks in the indices (and ETFs) force too much liquidity into too few stocks? We’ve been arguing that the depth of liquidity has been low – both on the way up and the way down, and too much is being channeled into too few names. This is no fault of any of the individual names (other than they have had incredible success growing into great businesses), but the “passive” investing makes it difficult sometimes to see the forest for the trees, and I suspect this might be one of those times.
It is unclear and we need to see where we head in the coming days and weeks, but the stock market once again feels ripe for a sharp, fast pullback. If I’m right on yields, this could certainly help push us in that direction.
Tyler Durden Sun, 06/23/2024 – 15:10
Source: https://freedombunker.com/2024/06/23/fragility-in-a-one-stock-stock-market/
Anyone can join.
Anyone can contribute.
Anyone can become informed about their world.
"United We Stand" Click Here To Create Your Personal Citizen Journalist Account Today, Be Sure To Invite Your Friends.
Humic & Fulvic Liquid Trace Mineral Complex
HerbAnomic’s Humic and Fulvic Liquid Trace Mineral Complex is a revolutionary New Humic and Fulvic Acid Complex designed to support your body at the cellular level. Our product has been thoroughly tested by an ISO/IEC Certified Lab for toxins and Heavy metals as well as for trace mineral content. We KNOW we have NO lead, arsenic, mercury, aluminum etc. in our Formula. This Humic & Fulvic Liquid Trace Mineral complex has high trace levels of naturally occurring Humic and Fulvic Acids as well as high trace levels of Zinc, Iron, Magnesium, Molybdenum, Potassium and more. There is a wide range of up to 70 trace minerals which occur naturally in our Complex at varying levels. We Choose to list the 8 substances which occur in higher trace levels on our supplement panel. We don’t claim a high number of minerals as other Humic and Fulvic Supplements do and leave you to guess which elements you’ll be getting. Order Your Humic Fulvic for Your Family by Clicking on this Link , or the Banner Below.

Our Formula is an exceptional value compared to other Humic Fulvic Minerals because...
It’s OXYGENATED
It Always Tests at 9.5+ pH
Preservative and Chemical Free
Allergen Free
Comes From a Pure, Unpolluted, Organic Source
Is an Excellent Source for Trace Minerals
Is From Whole, Prehisoric Plant Based Origin Material With Ionic Minerals and Constituents
Highly Conductive/Full of Extra Electrons
Is a Full Spectrum Complex
Our Humic and Fulvic Liquid Trace Mineral Complex has Minerals, Amino Acids, Poly Electrolytes, Phytochemicals, Polyphenols, Bioflavonoids and Trace Vitamins included with the Humic and Fulvic Acid. Our Source material is high in these constituents, where other manufacturers use inferior materials.
Try Our Humic and Fulvic Liquid Trace Mineral Complex today. Order Yours Today by Following This Link.


| Online: | |
| Visits: | 1,615,985,648 |
| Stories: | 8,187,955 |
Whistler Blowers, Insiders
