
Numbers Don’t Lie

Authored by Robert Bryce via Substack,
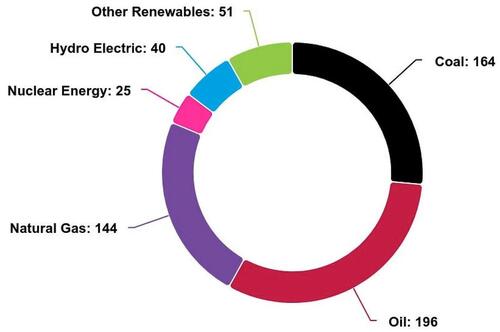
Global energy use in 2023 hit a new record, 620 EJ, of which about 81.5% came from hydrocarbons. Image: Energy Institute.
During his 16-year career in the NBA, Rasheed Wallace was among basketball’s most intimidating power forwards. He was also among the most volatile. Wallace holds the single-season record for technical fouls (41) and ranks third all-time in total technicals with 317.
In addition to his disdain for referees, the 6’11” Wallace, gained fame for a particular catchphrase. If “Sheed” or one of his teammates was called for a foul that he thought was undeserved, and the opposing player missed the ensuing free throw, he would often holler, “Ball don’t lie,” to indicate that the basketball knew the referee had made a bad call.
The ball don’t lie. Neither do the numbers in the latest Statistical Review of World Energy.
Amid the ongoing blizzard of propaganda about the “energy transition” and the tired antics of the goobers from Just Stop Oil — a pair of whom vandalized Stonehenge with orange paint last Wednesday — the Statistical Review, published by the Energy Institute, KPMG, and Kearney, provides a much-needed reality check to the narrative being promoted by major media outlets, academics, and the NGO-corporate-industrial-climate complex.

Rasheed Wallace on the verge of getting another technical foul in 2008. Photo: Wikipedia.
The new Statistical Review, released last Thursday, shows, yet again, that despite the hype, subsidies, and mandates, wind and solar energy aren’t keeping pace with the growth in hydrocarbons. Global hydrocarbon use and CO2 emissions hit record highs in 2023, with hydrocarbon consumption up 1.5% to 504 exajoules (EJ). That increase was “driven by coal, up 1.6%, [and] oil up 2% to above 100 million barrels [per day] for the first time.” Global natural gas demand was flat, mainly due to stunning declines in Europe. Gas demand in the U.K. fell by 10%. It also fell by 11% in Spain, 10% in Italy, and 11% in France.
Soaring electricity demand was, yet again, the big story in 2023. Global power generation increased by 2.5% to 29,924 terawatt-hours. About 32% of that juice (9,456 TWh) was generated in China, where electricity production surged by nearly 7%. The U.S. came in a distant second in power generated, with 4,494 TWh. Domestic power production dropped by about 1% last year. Power generation in India also increased by about 7% last year to a record 1,958 TWh, 75% of which came from coal-fired power plants.
I look forward to the release of the Statistical Review every year because the data can be downloaded in Excel. That allows me and others to make meaningful comparisons beyond the spin. Numerical comparisons are essential ingredients in the debate over energy and climate policy. The best advice I ever got on presenting numbers came from author and statistician Edward Tufte. He said: whenever you give people a number, give them a familiar metric so they can make a comparison. That advice changed the course of my career. Here are nine charts from the Statistical Review.
Chart 1
I published this chart last month in “What The Media Won’t Tell You About The Energy Transition.” I’ve updated it with the latest figures from Bloomberg New Energy Finance and the Statistical Review.
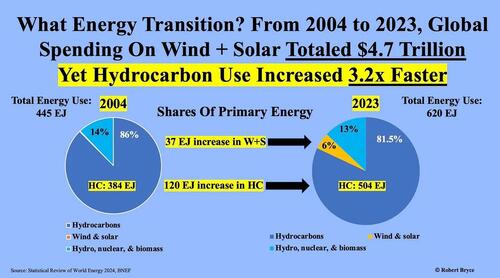
Chart 2
Chart 3
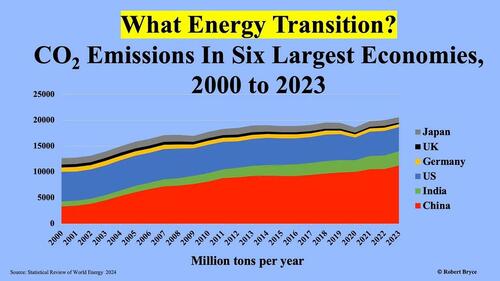
Chart 4
This graphic uses the same numbers as the one in the previous slide but has higher resolution because the numbers can be compared more easily. It clearly shows that the reductions in emissions in the West are being swamped by the massive increases in China and India.
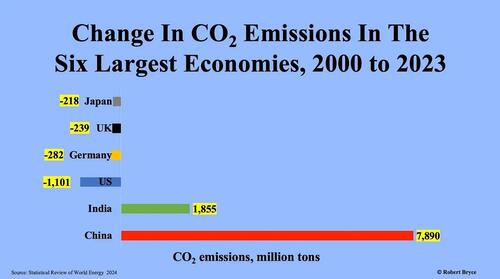
Chart 5
The U.S. again led the world in emissions reductions in 2023, but as shown in the previous two slides, those reductions are being swamped by the growth in India and China.
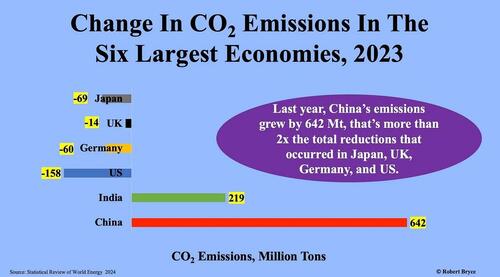
Chart 6
Climate activists can sling all the soup and paint they want, but oil remains the dominant form of energy consumed worldwide. Oil use increased slightly last year in the U.S., up about 0.5%. Meanwhile, consumption soared in China, up almost 11%. It was also up 5% in India and nearly 13% in Vietnam. The results: global demand jumped by about 2.3 million barrels per day, and oil use averaged over 100 million barrels per day for the first time in history.
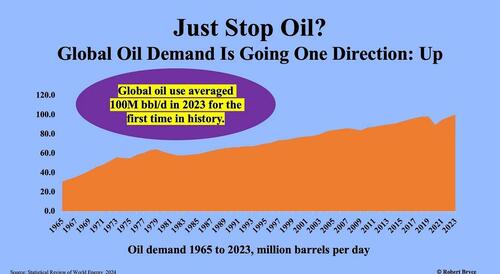
Chart 7
As I noted last December in “Two Days After COP28, IEA Delivers More Coal Hard Reality,” the International Energy Agency has been predicting a decline in global coal demand for years. I explained that in 2015, the IEA claimed, ‘The golden age of coal in China seems to be over.” That year, the agency predicted global coal demand would fall to 5.5 billion tons by 2020. That didn’t happen. Instead of falling, coal demand keeps powering upward, with major increases in China and India. Other Asian countries, including Vietnam, the Philippines, and Bangladesh, are also burning more coal.
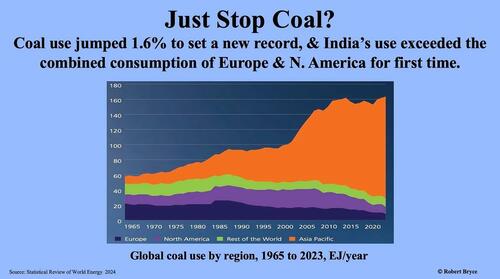
Chart 8
The Inflation Reduction Act provides tens of billions of dollars in subsidies for wind and solar in the U.S. However, as seen below, gas-fired generation is still growing faster than those two sources combined. Note that in 2023, wind generation fell despite the addition of 6 gigawatts of capacity. Why? The wind didn’t blow.
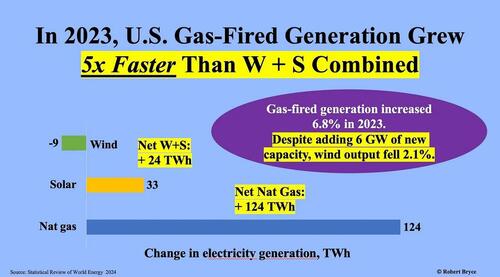
Chart 9
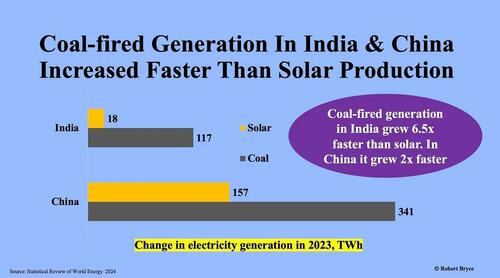
We are carpet bombed with claims that alt-energy — and solar in particular — is cheaper than other forms of electricity production. And yet, in China and India, coal-fired generation continues to grow faster than solar. Maybe they didn’t get the memo.
I will continue pulling numbers from the Statistical Review until June 2025, when the next edition is published. And I will repeat here a line I use in my speaking engagements: These aren’t my numbers. These are the numbers.
And the numbers don’t lie.
Tyler Durden Sat, 06/29/2024 – 10:30
Source: https://freedombunker.com/2024/06/29/numbers-dont-lie/
Anyone can join.
Anyone can contribute.
Anyone can become informed about their world.
"United We Stand" Click Here To Create Your Personal Citizen Journalist Account Today, Be Sure To Invite Your Friends.
Humic & Fulvic Liquid Trace Mineral Complex
HerbAnomic’s Humic and Fulvic Liquid Trace Mineral Complex is a revolutionary New Humic and Fulvic Acid Complex designed to support your body at the cellular level. Our product has been thoroughly tested by an ISO/IEC Certified Lab for toxins and Heavy metals as well as for trace mineral content. We KNOW we have NO lead, arsenic, mercury, aluminum etc. in our Formula. This Humic & Fulvic Liquid Trace Mineral complex has high trace levels of naturally occurring Humic and Fulvic Acids as well as high trace levels of Zinc, Iron, Magnesium, Molybdenum, Potassium and more. There is a wide range of up to 70 trace minerals which occur naturally in our Complex at varying levels. We Choose to list the 8 substances which occur in higher trace levels on our supplement panel. We don’t claim a high number of minerals as other Humic and Fulvic Supplements do and leave you to guess which elements you’ll be getting. Order Your Humic Fulvic for Your Family by Clicking on this Link , or the Banner Below.

Our Formula is an exceptional value compared to other Humic Fulvic Minerals because...
It’s OXYGENATED
It Always Tests at 9.5+ pH
Preservative and Chemical Free
Allergen Free
Comes From a Pure, Unpolluted, Organic Source
Is an Excellent Source for Trace Minerals
Is From Whole, Prehisoric Plant Based Origin Material With Ionic Minerals and Constituents
Highly Conductive/Full of Extra Electrons
Is a Full Spectrum Complex
Our Humic and Fulvic Liquid Trace Mineral Complex has Minerals, Amino Acids, Poly Electrolytes, Phytochemicals, Polyphenols, Bioflavonoids and Trace Vitamins included with the Humic and Fulvic Acid. Our Source material is high in these constituents, where other manufacturers use inferior materials.
Try Our Humic and Fulvic Liquid Trace Mineral Complex today. Order Yours Today by Following This Link.


| Online: | |
| Visits: | 1,616,697,019 |
| Stories: | 8,189,693 |
Whistler Blowers, Insiders
