

How America’s Wealth Distribution Has Changed Over The Last 40 Years

Wealth reflects the value of everything households own, including homes, stocks, businesses, and savings, minus what they owe.
Because different wealth groups own very different mixes of assets, long-term market trends can reshape how the nation’s wealth is divided.
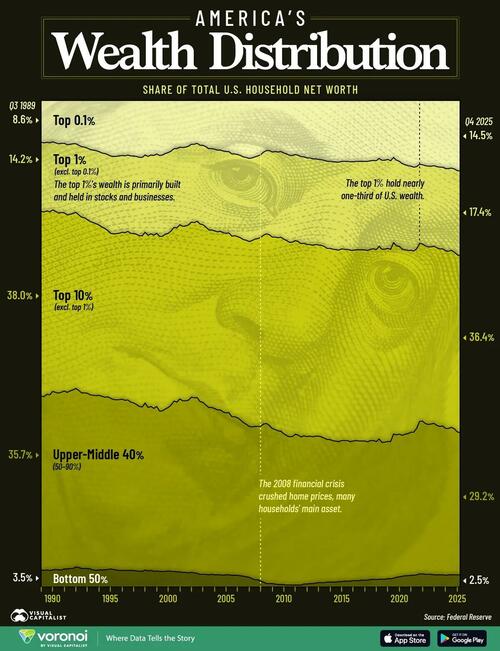
This graphic, via Visual Capitalist’s Boyan Girginov, tracks how U.S. household wealth has shifted across wealth groups from Q3 1989 to Q4 2025 using data from the Federal Reserve’s Distributional Financial Accounts.
Wealth of the Top 1% vs. the Bottom 90%
The table below shows how the wealth distribution has changed over the last 35 years:
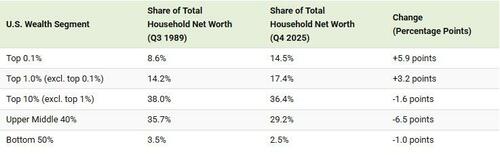
The top 1% built its wealth primarily through stocks and businesses, assets that have soared in value for decades. In fact, every group below the top 1% has lost share since 1989: even the next 9% of households, from the 90th to 99th percentiles, slipped from 38.0% to 36.4%.
Wealth further down the ladder is tied mostly to the family home, which appreciates far more slowly than the stock market. Much of the bottom 50%’s net worth is home equity, and many households in that group have little or no net worth at all. That’s why the gap between the top and the bottom has widened over the last 36 years.
How Markets Move Each Group’s Share
Market swings move each group’s share differently, depending on the assets its households own.
Every boom rewards whoever holds financial assets, and those gains compound: between 1989 and 2025, the top 0.1% increased its share of household wealth from 8.6% to 14.5%, while the top 1% as a whole climbed from 22.8% to 31.9%.
Busts fall hardest on those with the least cushion. The 2008 housing crash crushed the value of ordinary households’ main asset, and the bottom 50%’s share eventually fell to a record low of 0.4% before recovering to 2.5% today.
Over the full period, no group lost more ground than the upper-middle 40%, households between the 50th and 90th percentiles, whose share slid from 35.7% to 29.2% as home values trailed the stock market.
Wealth Distribution by Income Segment (1989-2025)
See all the data for the last 36 years below:
| Time Period | Top 0.1% | Top 1% (excl. top 0.1%) |
Top 10% (excl. top 1%) |
Upper-Middle 40% (excl. top 10%) |
Bottom 50% |
|---|---|---|---|---|---|
| Q3 1989 | 8.6% | 14.2% | 38.0% | 35.7% | 3.5% |
| Q4 1989 | 8.7% | 14.2% | 37.9% | 35.7% | 3.4% |
| Q1 1990 | 8.6% | 14.1% | 37.7% | 36.1% | 3.5% |
| Q2 1990 | 8.7% | 14.2% | 37.6% | 36.1% | 3.4% |
| Q3 1990 | 8.5% | 14.0% | 37.3% | 36.7% | 3.5% |
| Q4 1990 | 8.7% | 14.1% | 37.2% | 36.4% | 3.6% |
| Q1 1991 | 8.9% | 14.2% | 37.0% | 36.3% | 3.5% |
| Q2 1991 | 8.8% | 14.2% | 36.9% | 36.5% | 3.5% |
| Q3 1991 | 8.8% | 14.3% | 36.6% | 36.6% | 3.7% |
| Q4 1991 | 9.1% | 14.4% | 36.5% | 36.3% | 3.7% |
| Q1 1992 | 9.0% | 14.4% | 36.3% | 36.5% | 3.8% |
| Q2 1992 | 8.9% | 14.3% | 36.3% | 36.7% | 3.8% |
| Q3 1992 | 8.9% | 14.1% | 36.2% | 36.7% | 4.1% |
| Q4 1992 | 9.2% | 14.3% | 36.1% | 36.4% | 4.0% |
| Q1 1993 | 9.5% | 14.5% | 36.1% | 36.1% | 3.8% |
| Q2 1993 | 9.6% | 14.5% | 36.0% | 36.1% | 3.8% |
| Q3 1993 | 9.8% | 14.7% | 35.7% | 36.0% | 3.8% |
| Q4 1993 | 10.1% | 14.8% | 35.6% | 35.8% | 3.7% |
| Q1 1994 | 10.2% | 14.9% | 35.5% | 35.9% | 3.5% |
| Q2 1994 | 10.3% | 15.0% | 35.3% | 35.9% | 3.4% |
| Q3 1994 | 10.5% | 15.1% | 35.0% | 35.9% | 3.5% |
| Q4 1994 | 10.8% | 15.2% | 34.8% | 35.7% | 3.5% |
| Q1 1995 | 10.9% | 15.4% | 34.7% | 35.5% | 3.5% |
| Q2 1995 | 11.1% | 15.6% | 34.2% | 35.5% | 3.6% |
| Q3 1995 | 11.4% | 15.9% | 33.9% | 35.1% | 3.7% |
| Q4 1995 | 11.5% | 15.9% | 34.0% | 34.9% | 3.6% |
| Q1 1996 | 11.5% | 15.9% | 34.2% | 35.0% | 3.5% |
| Q2 1996 | 11.4% | 15.9% | 34.2% | 35.1% | 3.4% |
| Q3 1996 | 11.3% | 15.8% | 34.3% | 35.2% | 3.4% |
| Q4 1996 | 11.4% | 15.8% | 34.5% | 35.0% | 3.4% |
| Q1 1997 | 11.2% | 15.7% | 34.6% | 35.0% | 3.4% |
| Q2 1997 | 11.4% | 15.9% | 34.7% | 34.6% | 3.4% |
| Q3 1997 | 11.4% | 15.9% | 34.8% | 34.4% | 3.4% |
| Q4 1997 | 11.5% | 16.0% | 35.0% | 34.2% | 3.3% |
| Q1 1998 | 11.7% | 16.1% | 35.1% | 33.8% | 3.3% |
| Q2 1998 | 11.7% | 16.1% | 35.2% | 33.8% | 3.2% |
| Q3 1998 | 11.2% | 15.9% | 35.1% | 34.3% | 3.5% |
| Q4 1998 | 11.5% | 16.2% | 35.4% | 33.6% | 3.3% |
| Q1 1999 | 11.2% | 16.2% | 35.5% | 33.7% | 3.4% |
| Q2 1999 | 11.3% | 16.4% | 35.6% | 33.5% | 3.2% |
| Q3 1999 | 11.0% | 16.3% | 35.6% | 33.8% | 3.3% |
| Q4 1999 | 11.3% | 16.6% | 35.9% | 32.9% | 3.2% |
| Q1 2000 | 11.2% | 16.7% | 35.9% | 33.0% | 3.2% |
| Q2 2000 | 10.9% | 16.6% | 35.9% | 33.4% | 3.2% |
| Q3 2000 | 10.7% | 16.6% | 35.8% | 33.6% | 3.3% |
| Q4 2000 | 10.4% | 16.4% | 35.8% | 34.2% | 3.2% |
| Q1 2001 | 9.9% | 16.2% | 35.7% | 35.0% | 3.2% |
| Q2 2001 | 9.9% | 16.3% | 35.8% | 34.9% | 3.1% |
| Q3 2001 | 9.6% | 16.0% | 35.8% | 35.6% | 3.1% |
| Q4 2001 | 9.7% | 16.2% | 35.9% | 35.3% | 3.0% |
| Q1 2002 | 9.6% | 16.2% | 36.0% | 35.3% | 3.0% |
| Q2 2002 | 9.4% | 16.2% | 36.0% | 35.5% | 2.9% |
| Q3 2002 | 9.0% | 16.0% | 36.0% | 36.0% | 3.0% |
| Q4 2002 | 9.0% | 16.1% | 36.0% | 36.0% | 2.9% |
| Q1 2003 | 8.8% | 16.0% | 36.2% | 36.1% | 2.8% |
| Q2 2003 | 9.2% | 16.2% | 36.5% | 35.5% | 2.6% |
| Q3 2003 | 9.2% | 16.3% | 36.5% | 35.3% | 2.6% |
| Q4 2003 | 9.5% | 16.5% | 36.6% | 34.8% | 2.6% |
| Q1 2004 | 9.9% | 16.7% | 36.5% | 34.4% | 2.5% |
| Q2 2004 | 9.9% | 16.7% | 36.5% | 34.3% | 2.6% |
| Q3 2004 | 10.0% | 16.8% | 36.5% | 34.2% | 2.5% |
| Q4 2004 | 10.2% | 16.8% | 36.6% | 33.9% | 2.5% |
| Q1 2005 | 10.2% | 16.7% | 36.7% | 33.9% | 2.5% |
| Q2 2005 | 10.4% | 16.8% | 36.9% | 33.6% | 2.4% |
| Q3 2005 | 10.5% | 16.8% | 36.9% | 33.3% | 2.5% |
| Q4 2005 | 10.5% | 16.7% | 36.9% | 33.3% | 2.5% |
| Q1 2006 | 11.0% | 16.9% | 37.1% | 32.6% | 2.4% |
| Q2 2006 | 11.0% | 16.8% | 37.2% | 32.6% | 2.4% |
| Q3 2006 | 11.1% | 16.9% | 37.3% | 32.4% | 2.4% |
| Q4 2006 | 11.3% | 16.9% | 37.4% | 32.0% | 2.3% |
| Q1 2007 | 11.6% | 17.0% | 37.6% | 31.6% | 2.2% |
| Q2 2007 | 11.7% | 17.0% | 37.8% | 31.3% | 2.1% |
| Q3 2007 | 11.9% | 17.1% | 38.0% | 31.0% | 2.0% |
| Q4 2007 | 11.8% | 17.0% | 38.3% | 31.2% | 1.7% |
| Q1 2008 | 11.6% | 16.9% | 38.5% | 31.5% | 1.5% |
| Q2 2008 | 11.4% | 17.0% | 38.6% | 31.5% | 1.5% |
| Q3 2008 | 11.2% | 17.0% | 38.9% | 31.9% | 1.2% |
| Q4 2008 | 10.6% | 17.1% | 38.8% | 32.5% | 1.0% |
| Q1 2009 | 10.3% | 17.1% | 39.0% | 32.9% | 0.7% |
| Q2 2009 | 10.3% | 17.3% | 39.2% | 32.5% | 0.7% |
| Q3 2009 | 10.6% | 17.5% | 39.4% | 31.9% | 0.7% |
| Q4 2009 | 10.5% | 17.6% | 39.6% | 31.8% | 0.6% |
| Q1 2010 | 10.6% | 17.6% | 39.7% | 31.6% | 0.5% |
| Q2 2010 | 10.5% | 17.6% | 39.9% | 31.5% | 0.5% |
| Q3 2010 | 10.8% | 17.7% | 40.0% | 31.0% | 0.5% |
| Q4 2010 | 11.0% | 17.8% | 40.1% | 30.7% | 0.4% |
| Q1 2011 | 11.3% | 17.9% | 40.0% | 30.5% | 0.4% |
| Q2 2011 | 11.3% | 17.8% | 39.9% | 30.5% | 0.4% |
| Q3 2011 | 11.1% | 17.7% | 39.8% | 31.0% | 0.4% |
| Q4 2011 | 11.3% | 17.7% | 39.8% | 30.8% | 0.4% |
| Q1 2012 | 11.5% | 17.9% | 39.7% | 30.4% | 0.4% |
| Q2 2012 | 11.6% | 17.8% | 39.6% | 30.5% | 0.6% |
| Q3 2012 | 11.8% | 17.8% | 39.5% | 30.3% | 0.6% |
| Q4 2012 | 11.8% | 17.8% | 39.4% | 30.3% | 0.7% |
| Q1 2013 | 12.0% | 17.8% | 39.4% | 30.2% | 0.7% |
| Q2 2013 | 12.0% | 17.6% | 39.4% | 30.2% | 0.8% |
| Q3 2013 | 12.1% | 17.6% | 39.3% | 30.1% | 0.9% |
| Q4 2013 | 12.2% | 17.6% | 39.4% | 30.0% | 0.9% |
| Q1 2014 | 12.3% | 17.7% | 39.4% | 29.7% | 0.9% |
| Q2 2014 | 12.5% | 17.9% | 39.3% | 29.3% | 1.0% |
| Q3 2014 | 12.5% | 17.9% | 39.3% | 29.3% | 1.0% |
| Q4 2014 | 12.6% | 18.0% | 39.4% | 29.1% | 1.0% |
| Q1 2015 | 12.6% | 18.0% | 39.3% | 28.9% | 1.0% |
| Q2 2015 | 12.7% | 18.1% | 39.4% | 28.8% | 1.1% |
| Q3 2015 | 12.5% | 18.0% | 39.4% | 29.0% | 1.1% |
| Q4 2015 | 12.5% | 18.1% | 39.3% | 28.9% | 1.2% |
| Q1 2016 | 12.5% | 18.1% | 39.3% | 28.9% | 1.2% |
| Q2 2016 | 12.6% | 18.2% | 39.4% | 28.7% | 1.2% |
| Q3 2016 | 12.6% | 18.2% | 39.2% | 28.7% | 1.3% |
| Q4 2016 | 12.5% | 18.2% | 39.2% | 28.8% | 1.3% |
| Q1 2017 | 12.5% | 18.2% | 39.3% | 28.7% | 1.3% |
| Q2 2017 | 12.5% | 18.2% | 39.3% | 28.6% | 1.4% |
| Q3 2017 | 12.5% | 18.2% | 39.3% | 28.6% | 1.4% |
| Q4 2017 | 12.5% | 18.3% | 39.3% | 28.4% | 1.4% |
| Q1 2018 | 12.4% | 18.2% | 39.3% | 28.6% | 1.5% |
| Q2 2018 | 12.3% | 18.2% | 39.4% | 28.5% | 1.6% |
| Q3 2018 | 12.4% | 18.3% | 39.5% | 28.4% | 1.5% |
| Q4 2018 | 11.9% | 18.1% | 39.6% | 28.8% | 1.6% |
| Q1 2019 | 12.3% | 18.3% | 39.7% | 28.1% | 1.6% |
| Q2 2019 | 12.3% | 18.3% | 39.7% | 28.2% | 1.6% |
| Q3 2019 | 12.1% | 18.3% | 39.7% | 28.2% | 1.7% |
| Q4 2019 | 12.4% | 18.2% | 39.5% | 28.2% | 1.7% |
| Q1 2020 | 11.7% | 17.5% | 39.3% | 29.6% | 1.8% |
| Q2 2020 | 12.3% | 17.6% | 38.9% | 29.3% | 2.0% |
| Q3 2020 | 12.5% | 17.5% | 38.6% | 29.3% | 2.1% |
| Q4 2020 | 13.0% | 17.6% | 38.3% | 29.0% | 2.2% |
| Q1 2021 | 13.2% | 17.5% | 37.9% | 29.1% | 2.3% |
| Q2 2021 | 13.4% | 17.4% | 37.6% | 29.2% | 2.3% |
| Q3 2021 | 13.5% | 17.3% | 37.4% | 29.4% | 2.4% |
| Q4 2021 | 13.7% | 17.2% | 37.2% | 29.4% | 2.4% |
| Q1 2022 | 13.6% | 16.9% | 36.9% | 30.1% | 2.5% |
| Q2 2022 | 13.1% | 16.3% | 36.5% | 31.3% | 2.7% |
| Q3 2022 | 13.2% | 16.3% | 36.4% | 31.4% | 2.7% |
| Q4 2022 | 13.4% | 16.5% | 36.5% | 31.0% | 2.6% |
| Q1 2023 | 13.5% | 16.6% | 36.5% | 30.8% | 2.6% |
| Q2 2023 | 13.5% | 16.6% | 36.4% | 30.9% | 2.6% |
| Q3 2023 | 13.4% | 16.5% | 36.4% | 31.1% | 2.5% |
| Q4 2023 | 13.6% | 16.7% | 36.5% | 30.7% | 2.5% |
| Q1 2024 | 13.7% | 16.8% | 36.5% | 30.5% | 2.5% |
| Q2 2024 | 13.7% | 16.8% | 36.4% | 30.6% | 2.5% |
| Q3 2024 | 14.0% | 16.9% | 36.5% | 30.2% | 2.4% |
| Q4 2024 | 14.0% | 17.0% | 36.4% | 30.1% | 2.5% |
| Q1 2025 | 13.9% | 16.9% | 36.4% | 30.3% | 2.5% |
| Q2 2025 | 14.1% | 17.1% | 36.4% | 30.1% | 2.5% |
| Q3 2025 | 14.4% | 17.3% | 36.4% | 29.4% | 2.5% |
| Q4 2025 | 14.5% | 17.4% | 36.4% | 29.2% | 2.5% |
If you enjoyed today’s post, check out The Global Wealth Pyramid in 2025 on Voronoi.
Tyler Durden Wed, 07/08/2026 – 05:45
Source: https://freedombunker.com/2026/07/08/how-americas-wealth-distribution-has-changed-over-the-last-40-years/
Anyone can join.
Anyone can contribute.
Anyone can become informed about their world.
"United We Stand" Click Here To Create Your Personal Citizen Journalist Account Today, Be Sure To Invite Your Friends.
Before It’s News® is a community of individuals who report on what’s going on around them, from all around the world. Anyone can join. Anyone can contribute. Anyone can become informed about their world. "United We Stand" Click Here To Create Your Personal Citizen Journalist Account Today, Be Sure To Invite Your Friends.
LION'S MANE PRODUCT
Try Our Lion’s Mane WHOLE MIND Nootropic Blend 60 Capsules
Mushrooms are having a moment. One fabulous fungus in particular, lion’s mane, may help improve memory, depression and anxiety symptoms. They are also an excellent source of nutrients that show promise as a therapy for dementia, and other neurodegenerative diseases. If you’re living with anxiety or depression, you may be curious about all the therapy options out there — including the natural ones.Our Lion’s Mane WHOLE MIND Nootropic Blend has been formulated to utilize the potency of Lion’s mane but also include the benefits of four other Highly Beneficial Mushrooms. Synergistically, they work together to Build your health through improving cognitive function and immunity regardless of your age. Our Nootropic not only improves your Cognitive Function and Activates your Immune System, but it benefits growth of Essential Gut Flora, further enhancing your Vitality.

Our Formula includes: Lion’s Mane Mushrooms which Increase Brain Power through nerve growth, lessen anxiety, reduce depression, and improve concentration. Its an excellent adaptogen, promotes sleep and improves immunity. Shiitake Mushrooms which Fight cancer cells and infectious disease, boost the immune system, promotes brain function, and serves as a source of B vitamins. Maitake Mushrooms which regulate blood sugar levels of diabetics, reduce hypertension and boosts the immune system. Reishi Mushrooms which Fight inflammation, liver disease, fatigue, tumor growth and cancer. They Improve skin disorders and soothes digestive problems, stomach ulcers and leaky gut syndrome. Chaga Mushrooms which have anti-aging effects, boost immune function, improve stamina and athletic performance, even act as a natural aphrodisiac, fighting diabetes and improving liver function. Try Our Lion’s Mane WHOLE MIND Nootropic Blend 60 Capsules Today. Be 100% Satisfied or Receive a Full Money Back Guarantee. Order Yours Today by Following This Link.


| Visits: | 1,827,564,670 |
| Stories: | 8,683,517 |
Whistler Blowers, Insiders

