
Other Planets Showing signs of Global Warming


|
While I have been skeptical of Svensmark’s cosmic ray theory up until now, it looks like the evidence is becoming too strong for me to ignore. The following results will surely be controversial, and the reader should remember that what follows is not peer reviewed, and is only a preliminary estimate. I’ve made calculations based upon satellite observations of how the global radiative energy balance has varied over the last 10 years (between Solar Max and Solar Min) as a result of variations in cosmic ray activity. The results suggest that the total (direct + indirect) solar forcing is at least 3.5 times stronger than that due to changing solar irradiance alone.
If this is anywhere close to being correct, it supports the claim that the sun has a much larger potential role (and therefore humans a smaller role) in climate change than what the “scientific consensus” states. Watch the Video by David Wilcock Here
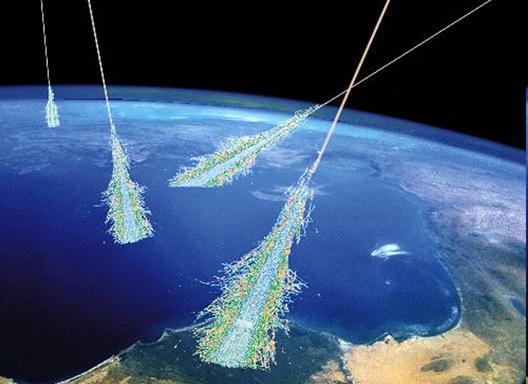
BACKGROUND The single most frequently asked question I get after I give my talks is, “Why didn’t you mention the sun?” I usually answer that I’m skeptical of the “cosmic ray gun” theory of cloud changes controlling climate. But I point out that Svensmark’s theory of natural cloud variations causing climate change is actually pretty close to what I preach — only the mechanism causing the cloud change is different. Then, I found last year’s paper by Laken et al. which was especially interesting since it showed satellite-observed cloud changes following changes in cosmic ray activity. Even though the ISCCP satellite data they used are not exactly state of the art, the study was limited to the mid-latitudes, and the time scales involved were days rather than years, the results gave compelling quantitative evidence of a cosmic ray effect on cloud cover. With the rapid-fire stream of publications and reports now coming out on the subject, I decided to go back and spend some time analyzing ground-based galactic cosmic ray (GCR) data to see whether there is a connection between GCR variations and variations in the global radiative energy balance between absorbed sunlight and emitted infrared energy, taken from the NASA CERES radiative budget instruments on the Terra satellite, available since March 2000. After all, that is ultimately what we are interested in: How do various forcings affect the radiative energy budget of the Earth? The results, I must admit, are enough for me to now place at least one foot solidly in the cosmic ray theory camp. THE DATA The nice thing about using CERES Earth radiative budget data is that we can get a quantitative estimate in Watts per sq. meter for the radiative forcing due to cosmic ray changes. This is the language the climate modelers speak, since these radiative forcings (externally imposed global energy imbalances) can be used to help calculate global temperature changes in the ocean & atmosphere based upon simple energy conservation. They can then also be compared to the estimates of forcing from increasing carbon dioxide, currently the most fashionable cause of climate change. From the global radiative budget measurements we also get to see if there is a change in high clouds (inferred from the outgoing infrared measurements) as well as low clouds (inferred from reflected shortwave [visible sunlight] measurements) associated with cosmic ray activity. I will use only the ground-based cosmic ray data from Moscow, since it is the first station I found which includes a complete monthly archive for the same period we have global radiative energy budget data from CERES (March 2000 through June 2010). I’m sure there are other stations, too…all of this is preliminary anyway. Me sifting through the myriad solar-terrestrial datasets is just as confusing to me as most of you sifting through the various climate datasets that I’m reasonably comfortable with. THE RESULTS The following plot (black curve) shows the monthly GCR data from Moscow for this period, as well as a detrended version with 1-2-1 averaging (red curve) to match the smoothing I will use in the CERES measurements to reduce noise. Detrending the data isolates the month-to-month and year-to-year variability as the signal to match, since trends (or a lack of trends) in the global radiative budget data can be caused by a combination of many things. (Linear trends are worthless for statistically inferring cause-and-effect; but getting a match between wiggles in two datasets is much less likely to be due to random chance.) The monthly cosmic ray data at Moscow will be compared to global monthly anomalies the NASA Terra satellite CERES (SSF 2.5 dataset) radiative flux data, which shows the variations in global average reflected sunlight (SW), emitted infrared (LW), and Net (which is the estimated imbalances in total absorbed energy by the climate system, after adjustment for variations in total solar irradiance, TSI). Note I have plotted the variations in the negative of Net, which is approximately equal to variations in (LW+SW)
Then, since the primary source of variability in the CERES data is associated with El Nino and La Nina (ENSO) activity, I subtracted out an estimate of the average ENSO influence using Finally, I performed regressions at various leads and lags between the GCR time series and the LW, SW, and -Net radiative flux time series, the results of which are shown next. The yearly average relationships noted in the previous plot come from this relationship in the reflected solar (SW) data, while the -Net flux (Net is absorbed solar minus emitted infrared, corrected for the change in solar irradiance during the period) results look like this: It is that last plot that gives us the final estimate of how a change in cosmic ray flux at Moscow is related to changes in Earth’s radiative energy balance. SUMMARY What the above three plots show is that for a 1,000 count increase in GCR activity as measured at Moscow (which is somewhat less than the increase between Solar Max and Solar Min), there appears to be:
(1) an increase in reflected sunlight (SW) of 0.64 Watts per sq. meter, probably mostly due to an increase in low cloud cover; WHAT DOES THIS MEAN FOR CLIMATE CHANGE? |
Anyone can join.
Anyone can contribute.
Anyone can become informed about their world.
"United We Stand" Click Here To Create Your Personal Citizen Journalist Account Today, Be Sure To Invite Your Friends.
Lion’s Mane Mushroom
Mushrooms are having a moment. One fabulous fungus in particular, lion’s mane, may help improve memory, depression and anxiety symptoms. They are also an excellent source of nutrients that show promise as a therapy for dementia, and other neurodegenerative diseases. If you’re living with anxiety or depression, you may be curious about all the therapy options out there — including the natural ones.Our Lion’s Mane WHOLE MIND Nootropic Blend has been formulated to utilize the potency of Lion’s mane but also include the benefits of four other Highly Beneficial Mushrooms. Synergistically, they work together to Build your health through improving cognitive function and immunity regardless of your age. Our Nootropic not only improves your Cognitive Function and Activates your Immune System, But it benefits growth of Essential Gut Flora, further enhancing your Vitality.

Our Formula includes:
Lion’s Mane Mushrooms which Increase Brain Power through nerve growth, lessen anxiety, reduce depression, and improve concentration. Its an excellent adaptogen, promotes sleep and improves immunity.
Shiitake Mushrooms which Fight cancer cells and infectious disease, boost the immune system, promotes brain function, and serves as a source of B vitamins.
Maitake Mushrooms which regulate blood sugar levels of diabetics, reduce hypertension and boosts the immune system.
Reishi Mushrooms which Fight inflammation, liver disease, fatigue, tumor growth and cancer. They Improve skin disorders and soothes digestive problems, stomach ulcers and leaky gut syndrome.
Chaga Mushrooms which have anti-aging effects, boost immune function, improve stamina and athletic performance, even act as a natural aphrodisiac, fighting diabetes and improving liver function.
Try Our Lion’s Mane WHOLE MIND Nootropic Blend 60 Capsules. Today Be 100% Satisfied Or Receive A Full Money Back Guarantee Order Yours Today By Following This Link.


| Online: | |
| Visits: | 1,609,638,692 |
| Stories: | 8,168,274 |
Whistler Blowers, Insiders
