
A Closer Look at New Jobless Claims


Before we begin, we’d like to acknowledge that we had absolutely nothing to do with what happened with oil prices or commodity prices or stock prices yesterday on 11 May 2011.
Nor did we, as one of Felix Salmon’s commenters recently suggested, claim that we “caused oil to tank” back on 5 May 2011.
Alas, as Felix pointed out in his post, the conditions that enabled what happened that day were already well in place. Moreover, oil prices had already begun falling well before we broke the news that the U.S. job market was doing much worse than the U.S. Department of Labor was letting on.
That oil prices then began their steepest decline of that day within minutes of our analysis going live may only be a coincidence. Or not. What we can do is describe the mechanism by which new information could have generated such an effect and we can also make a pretty good argument that information could very well have been a contributing factor to pushing oil prices down as fast as they went on that Thursday. But in no way should anyone believe that we have god-like powers over the price of oil.
It’s funny the things some people read in the things we write.
So today, we thought take a closer look at what caused us to declare the positive trend in falling new unemployment insurance applications that had existed beginning in 18 September 2010, so perhaps you can gain additional insight into why our analysis could very well have had such impact.
Our regular readers, many of whom do hail from the halls of power on Wall Street and other corners of the world, know that we recently refined our analytical methods for looking at weekly seasonally adjusted U.S. initial unemployment insurance claims data. Here, we’ve used a combination of regression analysis and applied statistical control chart analysis techniques to track major trends.
To be more precise in our terminology though, we should change the term “statistical control chart” to “statistical equilibrium chart” because the data isn’t generated by a controlled process.
We next looked at how we could use residual analysis to further narrow the most statistically likely range into which we can expect data to fall while a trend in in effect.
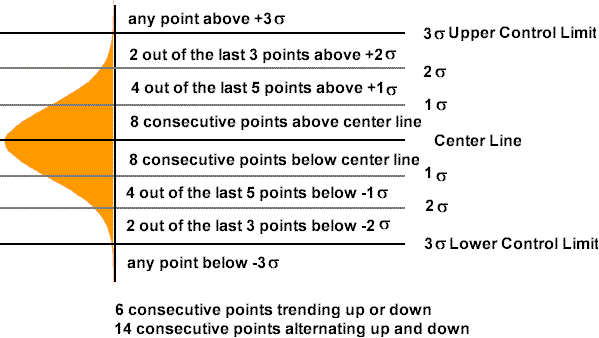
Having done that now, the real advantage of using these analytical techniques is that they allow us to apply some well-defined, statistically-based rules for determining when an established trend is no longer in effect (see the sideways bell curve image above describing these rules). Originally developed by Western Electric, these rules are now recognized as standards in many industries that utilize this kind of analysis to discover if and when their production processes might be going out of their desired level of control or that they have been affected by non-randomly occurring factors.
In our application, they tell us what values we can expect to see if a trend is still in effect or, as we’re about to show you, when an existing trend has broken down.
Let’s look at a close-up of the residual distribution for the trend we declared to have ended back on 2 April 2011:
Right away, you can see that two of the data points, for 23 April 2011 and for 30 April 2011, are well outside the bands that would trigger an alarm for Western Electric Rule #1: any data point that is more than three standard deviations from the mean trend line, which you can easily see because we’ve grafted our visual depiction of the rules onto our chart above.
Consider the table below, which we’ve updated with the data just released today, to see why these data points represent such an alarming condition. Here, we’ve calculated the odds of the previous trend of improvement in these numbers still being intact, which would mean that all the data points we’ve shown are just outliers, as the U.S. Department of Labor was claiming just last week. The relevant standard deviation for our residual distribution is 12,457.7:
| Week Ending | “Expected” (Mean Trend) Value | Actual (Recorded) Value | Difference from Mean Trend Value | Z Score (Difference Divided by Standard Deviation) | Odds of Being an Outlier |
|---|---|---|---|---|---|
| 23 April 2011 | 378,448 | 431,000 | 52,552 | 4.218 | Less Than 1 in 80,552 |
| 30 April 2011 | 375,862 | 478,000 | 102,138 | 8.199 | Less Than 1 in 900 Trillion |
| 7 May 2011 | 373,276 | 434,000 | 60,724 | 4.874 | Less Than 1 in 1,764,431 |
By contrast with these data points, a data point could be just at the three standard deviation limit with a 1 in 741 chance of being “in control” and not trigger an alarm.
These very, very long odds that these data points are just outliers are why we declared the trend to be “officially over” last week. Tracking backwards in the data to find the point in time where the trend actually broke, we identified the week between 2 April 2011 and 9 April 2011 as being the most likely period in which that happened.
We then reviewed the news of two-to-three weeks earlier in time to identify the most likely cause of the break, which we identified as the national average for gasoline prices rising above the critical $3.50 per gallon level. This is the approximate amount of time it takes for a major change in the business outlook of employers making employee retention decisions to react to a change in their business outlook and for the effect of that reaction to show up in the new jobless claims numbers, which is paced by the most common payroll periods in the United States.
Any of our sharp readers with a decent background in statistics could have simply looked at the charts we presented back on 5 May 2011 and instantly determined that the U.S. job situation had become worse in recent weeks, and much worse than the Obama administration’s Department of Labor was spinning.
How hard would it have been then for just one of our readers on Wall Street to put in a large sell order for their oil position in response? It’s not like it would be especially difficult after seeing our analysis to then be able to see the writing on the wall for the likely future demand for oil and to put in a large sell order. That, in turn, could very well have initiated the cascade of computerized stop-loss sell orders that actually pushed down oil prices by $2.00 per barrel in the minutes after our post hit the Internet, as the market absorbed the news that the U.S. job situation was much worse than had earlier been presented.
If that’s what really happened, that is! We’re still not saying that we have god-like powers over oil prices. We’re saying that there are real reasons that investors could have reacted to our analysis just as we’ve just described within the timeframe we’ve described. And no matter how hard you might try, you can’t rule out the possibility that we may have more influence in places we’ve never been with people we do not know than all of us might have realized!…
But if it makes you feel better, you can still thank us for your not having to pay $5.00 per gallon gas so you can drive around much less expensively than that this summer. Better yet, just send us some of the cash savings from that!
Previously on Political Calculations
- Refined: Major Trends in U.S. Layoffs
- Narrowing the Bands for U.S. Layoff Trends
- A Clearly Broken Trend in U.S. Layoff Activity
- Changing the Outlook for Oil Prices
Image Credit: Appraisal Scoop
Read more at Political Calculations
Source:
Anyone can join.
Anyone can contribute.
Anyone can become informed about their world.
"United We Stand" Click Here To Create Your Personal Citizen Journalist Account Today, Be Sure To Invite Your Friends.
Please Help Support BeforeitsNews by trying our Natural Health Products below!
Order by Phone at 888-809-8385 or online at https://mitocopper.com M - F 9am to 5pm EST
Order by Phone at 866-388-7003 or online at https://www.herbanomic.com M - F 9am to 5pm EST
Order by Phone at 866-388-7003 or online at https://www.herbanomics.com M - F 9am to 5pm EST
Humic & Fulvic Trace Minerals Complex - Nature's most important supplement! Vivid Dreams again!
HNEX HydroNano EXtracellular Water - Improve immune system health and reduce inflammation.
Ultimate Clinical Potency Curcumin - Natural pain relief, reduce inflammation and so much more.
MitoCopper - Bioavailable Copper destroys pathogens and gives you more energy. (See Blood Video)
Oxy Powder - Natural Colon Cleanser! Cleans out toxic buildup with oxygen!
Nascent Iodine - Promotes detoxification, mental focus and thyroid health.
Smart Meter Cover - Reduces Smart Meter radiation by 96%! (See Video).


| Online: | |
| Visits: | 1,599,840,424 |
| Stories: | 8,140,391 |
Whistler Blowers, Insiders
