
These Are The Biggest Pain Trades

Last week saw renewed skepticism in the AI narrative, this week there is growing skepticism to the semiconductor narrative. A multitude of reasons from leveraged single-stock ETFs to a too hawkish Fed were apparent in explaining renewed Tech weakness. Indeed, despite Micron’s post earnings rally, which has now fully faded, much of the broader tech sector did not bounce back as might have been expected.
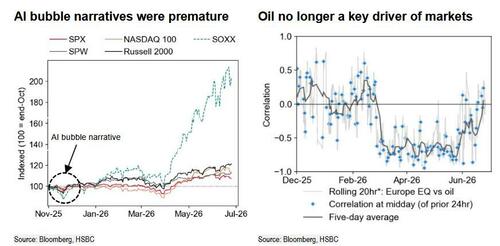
In a note laying out the biggest pain trades in the market currently, titled appropriately “The Biggest Pain Trades“ (available to pro subscribers) HSBC’s multi-asset strategist Duncan Toms writes that he is wary of how narratives can drive near-term market moves even if fundamentals do not justify changing tack. For example, last year’s AI bubble narrative saw US semiconductors fall c.15%. But as AI bottlenecks become more evident than bubbles, we saw a much more aggressive rally.
According to the self-admittedly bullish strategist, for HSBC to be more concerned right now, we’d need to see overly bullish sentiment and positioning. But by the bank’s measures this is firmly neutral. More dovish US rate expectations could be another catalyst for equity strength – and last week’s data prompted a tentative step in that direction. Elsewhere, oil is no longer a key driver of many financial markets
(see RHS chart below and high frequency correlations).
As we enter into the second half of the year a lot of views for H2 have become widely held. So to address the key pressure points, Duncan and his team highlight and outline key pain trades that could potentially catch the consensus off-guard. These pain trades are:
- The AI trade continues unabated
- Europe outperforms,
- an explosive USD rally,
- US Treasury curve steepening,
- EM yields decline
- a derailing of the Russell 2000 rally.
Pain trade #1: The AI trade continues unabated
The AI trade continues to face scrutiny and comparisons to the tech bubble of the late 1990s/early 2000s. The bubble narrative was rife in Q4 2025, but this broadly gave way to clear bottlenecks as agentic AI has led to even higher data center and chip demand (although today’s META news clearly dented that belief). Yet, HSBC laments,the bearish narratives keep coming.
So what if, instead, the AI trade just continues and valuations actually begin rising strongly again? Forward PE ratios currently suggest no sign of exuberance (Chart 1). For example, Nvidia at just under 20x is currently sitting at a 10-year low in its 12m forward PE ratio. That’s some contrast vs the equivalent metric for Monster Beverage at a 10-year high at just under 40x 12m forward PE (of course, forward PEs are cheap simply because consensus is projecting hockeystick earnings… and consensus has never been wrong before).
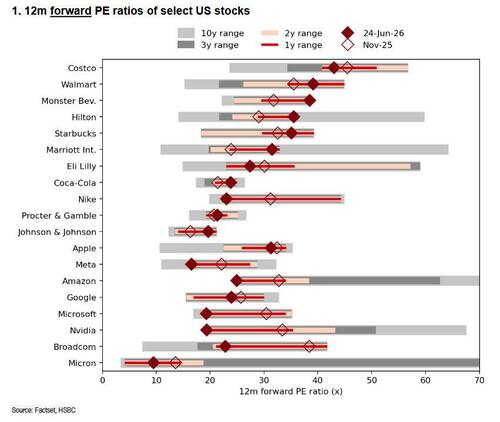
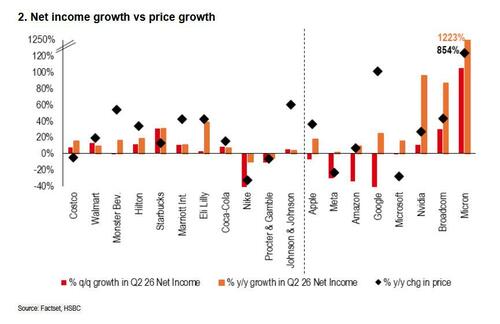
Firmly set in its bullish ways, HSBC thinks even a mere re-rating back towards middle-ranging valuations in the context of their own history will be enough to see the AI trade continue strongly. Here even HSBC admits that an alternative pushback is that future earnings expectations have become too positive and the reality check will then come. Yet the main problem with that is that many of these stocks have seen realized earnings growth over the last year outstrip stock price performance (to which one can answer that this is the result of frontloaded earnings through excess pricing and tokenmaxxing, both of which are no longer relevant thanks to a flood of extremely capable and cheap Chinese open-sources models).
So, all of Meta, Amazon, Microsoft, Nvidia, Broadcom, and Micron have seen trailing PE ratios fall too in the last 12m. The same can’t be said of many other parts of the markets.
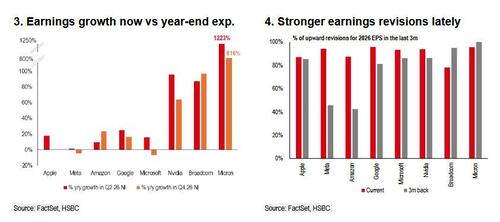
Here, HSBC proposes an even more aggressive bullish scenario, namely the possibility that earnings growth estimates haven’t yet caught up with strong earnings momentum. For many names at the forefront of the AI story in the US, expectations for full year 2026 earnings growth is flat or lower than the year-on-year earnings growth seen in the 12 months to Q2 2025. This is despite a pickup in earnings revisions ratio for these names in recent months. As such, while the narrative on AI continues to search for cracks, the pain trade could be continued strength and upside surprises on AI in H2.
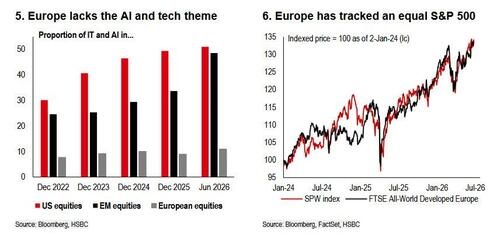
Pain trade #2: Europe outperforms
A view on European equities outperforming is in some respects very tied into views on the AI trade. On a market cap basis Europe does not have the same exposure to AI that can be attained in the US or even now Emerging Markets (Chart 5). Even away from that the resurgence of US exceptionalism keeps the idea of a European outperformance firmly away from consensus views. In some respects it might be surprising that European equities have actually closely tracked an equal weighted S&P 500 in recent years (Chart 6).
Two catalysts could prompt European equity outperformance: the first is a stronger USD. If this stronger USD is gradual and not driven by a haven bid in a risk-off move, then this can actually be a tailwind for European equities. A stronger USD would act as a headwind to mega-cap US earnings translating their foreign revenue back into the USDs, while act as the opposite tailwind for the more internationally exposed European Equity market. The second ingredient for possible European outperformance could be improving growth prospects. Since the start of the Iran conflict, consensus growth estimates for 2026 have fallen faster in Europe than the US.
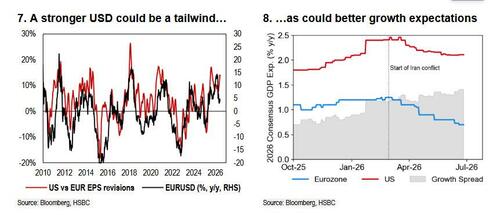
A reversal of this trend – or further, a re-appraisal of European growth expectations beyond pre-Iran levels – would help European equities catch up to other global regions.
Pain trade #3: An explosive USD rally
According to HSBC, the outcome of the June FOMC provided the key ingredient to re-embrace a stronger USD again, with the lack of forward guidance and focus on inflation keeping the currency supported. A more rapid and sizeable move from the Fed relative to elevated market pricing could lead to an explosive USD rally, as could a sharp re-escalation in geopolitical tensions.
The USD has strengthened after the June FOMC as markets took the even split among policymakers on potential rate hikes as a hawkish tilt, reflected in higher front-end US yields. This marked a clear shift from prior meetings toward a less dovish tone, which has in turn been supportive for the currency.
The explicit focus on a lack of forward guidance and pursuit of price stability is favoring the currency from a rates differential perspective, as rate hike pricing elsewhere recedes due to the softer outlook for oil prices but remains steady for the USD. HSBC thinkgs the FX market is increasingly likely to focus on fundamentals and move away slowly from geopolitical gyrations, with the June FOMC having acted as the catalyst. The bank now forecasts a gradually stronger broad USD, with it moving out of soft orbit . Rate differentials are therefore likely to continue gaining traction, but the currency still has a gap to close. A stronger USD would be painful, but HSBC sees the “pain trade” in the FX market taking the form of a more explosive period of USD strength. This would occur predominantly through two separate factors.
The first is if the Fed gives an indication in the coming months that it is prepared to act more aggressively than market pricing. Such a shift by the Fed would likely lead to a sharper ascent in the currency if this also translated into a rapid tightening of financial conditions. Key to this is the strength to which both near-term US activity and inflation data pan out.
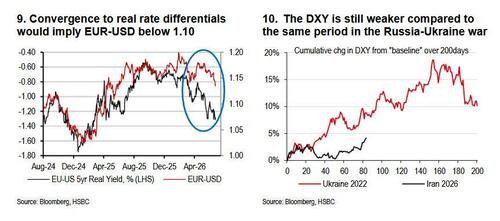
Explosive USD strength in this scenario could be amplified by a concurrent re-escalation of geopolitical tension. The USD’s correlation with oil price movements appears to be weakening, as it has strengthened in recent sessions while oil prices have softened. Despite this, one can’t rule out the USD benefitting if geopolitical headlines began to drive the FX market once again and Brent prices rose abruptly.
A combination of these factors could set the USD on course for a steeper appreciation than our current forecasts. It would also likely set the currency on track for similar potent performance to that seen in 2022.
Pain trade #4: US Treasury curve steepening
Flipping the script: Bond markets came into 2026 on the back of three consecutive 25bp rate cuts from the Fed − and with both the FOMC’s dot plot and forward pricing pointing to lower policy rates by year-end at the time, Treasury curve steepening was a clear-cut consensus expectation in January.
That view has since flipped. Risks to the Fed’s dual mandate have shifted sharply, and markets have repriced the policy path. Conflict in the Middle East, the effective closure of the Strait of Hormuz, and the resulting oil shock pushed up both headline and core inflation. Meanwhile, the labor market has stayed resilient: unemployment has held steady and non-farm payrolls have risen year-to-date. Front-end yields are markedly higher, driving curve bear flattening; 2s10s and 5s30s have each compressed by around 45bp
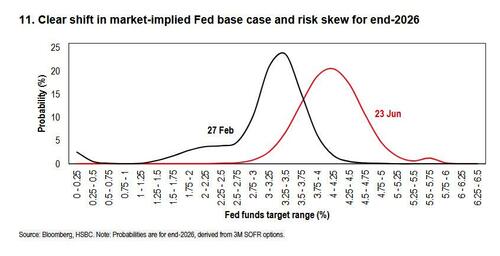
Against this backdrop, a return to bull steepening forces driving the Treasury curve has become increasingly hard to envision absent clear signs of economic deterioration – which has yet to emerge in the data. This shift in risk cases can be starkly seen in options-implied Fed funds rate distributions.
The HSBC chart below depicts the probability weight for each Fed funds target range based on 3M SOFR options. As recently as end-February, markets were evidently looking for modest rate cuts as a baseline, and saw risks meaningfully skewed to the “left-tail” amid narratives around the impact of AI on the labor market. Since then, however, this skew has been effectively entirely priced out. “Right-tail” risks of meaningful rate hikes have become a key concern based on these distributions.
HSBC also sees a shift in market narratives at the long-end of the curve. At the November Treasury refunding announcement, policymakers indicated there were considerations of potential increases to coupon supply further out the curve. Such a move would prompt curve bear steepening as higher long-end issuance may spark supply-demand imbalance concerns. The Treasury has since, however, maintained its forward guidance that issuance needs would continue to be met by incremental T-bill issuance for at least the next several quarters. Steepening moves led by the long-end thus appear less likely as well.
Taken together, the evolution of risks to the Fed’s dual mandate and skews to forward rate pricing increasingly reflect a market primarily concerned about Treasury curve flattening. And though positioning in flatteners may not be quite as crowded as steepeners were at the start of the year, curve steepening would now represent a pain trade for markets.
Pain trade #5: EM yields decline / duration rallies
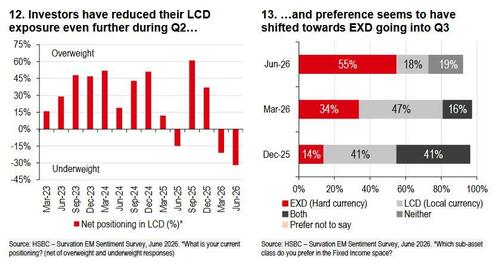
The last couple of months have been a proper resilience test for emerging markets, and investor caution towards EM local debt has become increasingly pronounced. HSBC’s latest EM Sentiment Survey shows local currency debt (LCD) as the weakest-positioned major EM asset class, with net positioning, i.e., the difference between overweight and underweight positions, falling further to -32% from -21% in March. Moreover, there seems to be a significant shift in fixed income preferences towards hard currency debt (EXD) as investors expect policy rates to creep higher over the next three months. In other words, investors appear to have positioned for persistent inflation pressure, limited monetary easing, and continued underperformance of local rates amidst a stronger US dollar.
But what if the next pain trade is not another spike in EM yields, but a rally in EM duration?
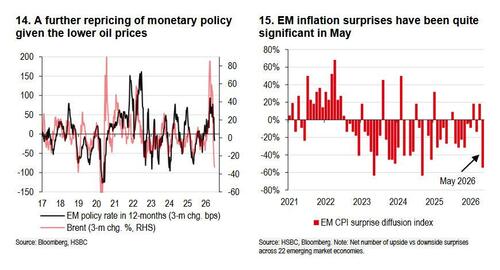
he first catalyst might be the sharp reversal in oil prices. The surge in energy prices following the Middle East conflict triggered an aggressive hawkish repricing of monetary policy, as investors accounted for higher inflation. That said, oil prices have seen a sharp decline (down by 25%) following the deal between the US and Iran, which has also been accompanied by investors pricing out some the expected EM rate hikes (chart 14). Should oil prices remain around current levels – or fall further – the case for additional systemic tightening would weaken materially.
Meanwhile, the inflation data may also help with lower yields, given the aggressive upward revision to inflation forecasts. May CPI releases are cases in point; they surprised to the downside across the majority of 22 EM economies, pushing the EM CPI surprise diffusion index sharply into negative territory. With the bar now set high, downside inflation surprises may become easier to deliver, allowing investors to remove part of the inflation and policy premium currently embedded in curves.
Importantly, the long-end of the yield curves could also be supported by the easing of term premium, as stronger nominal growth could improve debt and fiscal ratios. Moreover, lower oil prices would support current account balances in energy importing economies. Taken together, these could ease some of the pressure on the currencies, particularly in markets where real yields remain high and recent tightening expectations look increasingly stretched, even in a backdrop of a stronger US dollar.
Pain trade #6: US rate hike fears could derail Russell 2000 rally
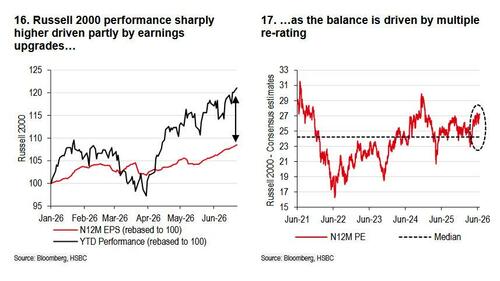
As we enter H2, the Russell 2000 has delivered standout performance, up 20% YTD. Small caps have also outperformed the S&P 500 by 12% − a sharp reversal versus the past five calendar years of underperformance. Russell 2000’s performance has been driven by
a roughly even mix of both improving earnings expectations as well as re-rating of valuations.
That said, the move could potentially become a pain trade driven by a combination of below points:
1) Oil prices – Brent has drifted lower at a sharp pace recently from USD118/bbl to cUSD74/bbl on the back of positive developments on Strait of Hormuz. There are still daily headlines on passing routes, tolls, authorization required for ships to pass; hence any setbacks in developments could lead to re-acceleration in oil prices, triggering a potential risk-off mode from a sentiment perspective. In such a scenario, investors would likely shift towards quality large cap stocks rather than small caps given their clear profitability gap (net margins for Russell 2000 at c5% vs c15% for SPX).
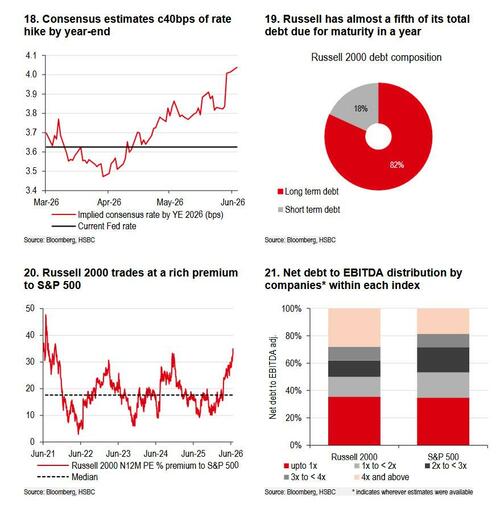
2) CPI and rate hike expectations – On the back of the previous point, consensus 2026e inflation expectations have been revised higher by c90bps to 3.5% since start of US-Iran war. This translates to consensus now estimating c40bps of rate hikes by year-end, a sharp reversal from the two rate cuts expected at the beginning of the year. Small-cap companies have around 20% of their debt maturing in the near term, meaning they may need to refinance at higher rates, putting pressure on profitability. At the same time, they are also more highly leveraged with net debt to EBITDA c5x vs 1.6x for S&P, leaving small caps more exposed if rates rise.
3) Lack of valuation support – Russell 2000 currently trades at a 12% premium to L5Y median range and also at 92nd percentile based on 30 years’ history; and the premium to the SPX has widened now as well to 35%, compared to median 18% historically (chart 20). Fundamentally, about a quarter of stocks within the index are estimated to report a loss in 2026e, and the median stock’s N12M ROE at just c10% vs 19% in the S&P 500.
Much more in the full Biggest Pain Trades report available to pro subscribers.
Tyler Durden Wed, 07/01/2026 – 20:45
Source: https://freedombunker.com/2026/07/01/these-are-the-biggest-pain-trades/
Anyone can join.
Anyone can contribute.
Anyone can become informed about their world.
"United We Stand" Click Here To Create Your Personal Citizen Journalist Account Today, Be Sure To Invite Your Friends.
Before It’s News® is a community of individuals who report on what’s going on around them, from all around the world. Anyone can join. Anyone can contribute. Anyone can become informed about their world. "United We Stand" Click Here To Create Your Personal Citizen Journalist Account Today, Be Sure To Invite Your Friends.
LION'S MANE PRODUCT
Try Our Lion’s Mane WHOLE MIND Nootropic Blend 60 Capsules
Mushrooms are having a moment. One fabulous fungus in particular, lion’s mane, may help improve memory, depression and anxiety symptoms. They are also an excellent source of nutrients that show promise as a therapy for dementia, and other neurodegenerative diseases. If you’re living with anxiety or depression, you may be curious about all the therapy options out there — including the natural ones.Our Lion’s Mane WHOLE MIND Nootropic Blend has been formulated to utilize the potency of Lion’s mane but also include the benefits of four other Highly Beneficial Mushrooms. Synergistically, they work together to Build your health through improving cognitive function and immunity regardless of your age. Our Nootropic not only improves your Cognitive Function and Activates your Immune System, but it benefits growth of Essential Gut Flora, further enhancing your Vitality.

Our Formula includes: Lion’s Mane Mushrooms which Increase Brain Power through nerve growth, lessen anxiety, reduce depression, and improve concentration. Its an excellent adaptogen, promotes sleep and improves immunity. Shiitake Mushrooms which Fight cancer cells and infectious disease, boost the immune system, promotes brain function, and serves as a source of B vitamins. Maitake Mushrooms which regulate blood sugar levels of diabetics, reduce hypertension and boosts the immune system. Reishi Mushrooms which Fight inflammation, liver disease, fatigue, tumor growth and cancer. They Improve skin disorders and soothes digestive problems, stomach ulcers and leaky gut syndrome. Chaga Mushrooms which have anti-aging effects, boost immune function, improve stamina and athletic performance, even act as a natural aphrodisiac, fighting diabetes and improving liver function. Try Our Lion’s Mane WHOLE MIND Nootropic Blend 60 Capsules Today. Be 100% Satisfied or Receive a Full Money Back Guarantee. Order Yours Today by Following This Link.


| Visits: | 1,823,502,401 |
| Stories: | 8,676,891 |
Whistler Blowers, Insiders
