

What Is Net Debt to EBITDA? Formula and Examples (2026)

Net debt to EBITDA is a borrowing ratio that divides a company’s total interest-bearing debt minus its cash by EBITDA, the earnings it makes before interest, tax, depreciation and amortization. In plain terms, it tells you how many years of core operating earnings the company would need to wipe out everything it owes after counting the cash on its balance sheet.
It is the single number lenders, credit rating agencies and private equity sponsors lean on hardest, because it puts companies of very different size and very different capital structures on the same scale. I also watch the trend rather than the single figure, because a ratio moving from 4x to 2x over three years tells a far more useful story than a static 2x.
In this guide you’ll get the formula, a full worked calculation with every input shown, plain-language bands for reading the answer, and the sector benchmarks that decide whether a number is genuinely good or just normal for that business.
What Is Net Debt to EBITDA?
It measures how many years of a company’s operating cash earnings it would take to repay its debt net of cash, and by extension how much room it has left if earnings fall.
Three things get bundled into that single figure, and separating them is most of the skill. The numerator is what the company owes to lenders after subtracting what it holds in cash. The denominator is what the business earns before financing and accounting decisions get involved. The gap between the two is the buffer.
The ratio gets used in three places more than anywhere else. Banks and rating agencies run it to grade default risk and set interest pricing. Private equity sponsors use it as the opening leverage target in a buyout, because it caps how much of the company’s cash flow can be borrowed against. Acquisition teams screen targets on it before anything else.
Individual investors use it as a screening filter, and that’s the sensible level of ambition for it. On its own it never tells you whether to buy a share. What it does well is answer a narrower and more valuable question: can this balance sheet survive a bad year?
It is also worth separating from two commonly confused measures. Debt to equity compares what the company owes against book value of owners’ equity, which moves around with asset revaluations and buybacks. Interest coverage divides operating profit by interest paid, which tells you whether this year’s payments are affordable but says nothing about the overall debt pile. Net debt to EBITDA looks at total indebtedness against total operating earnings, so it answers the payback question directly.
How Is Net Debt to EBITDA Calculated?
Divide net debt by EBITDA. That is the whole formula, and everything that makes it contentious sits inside those two halves.
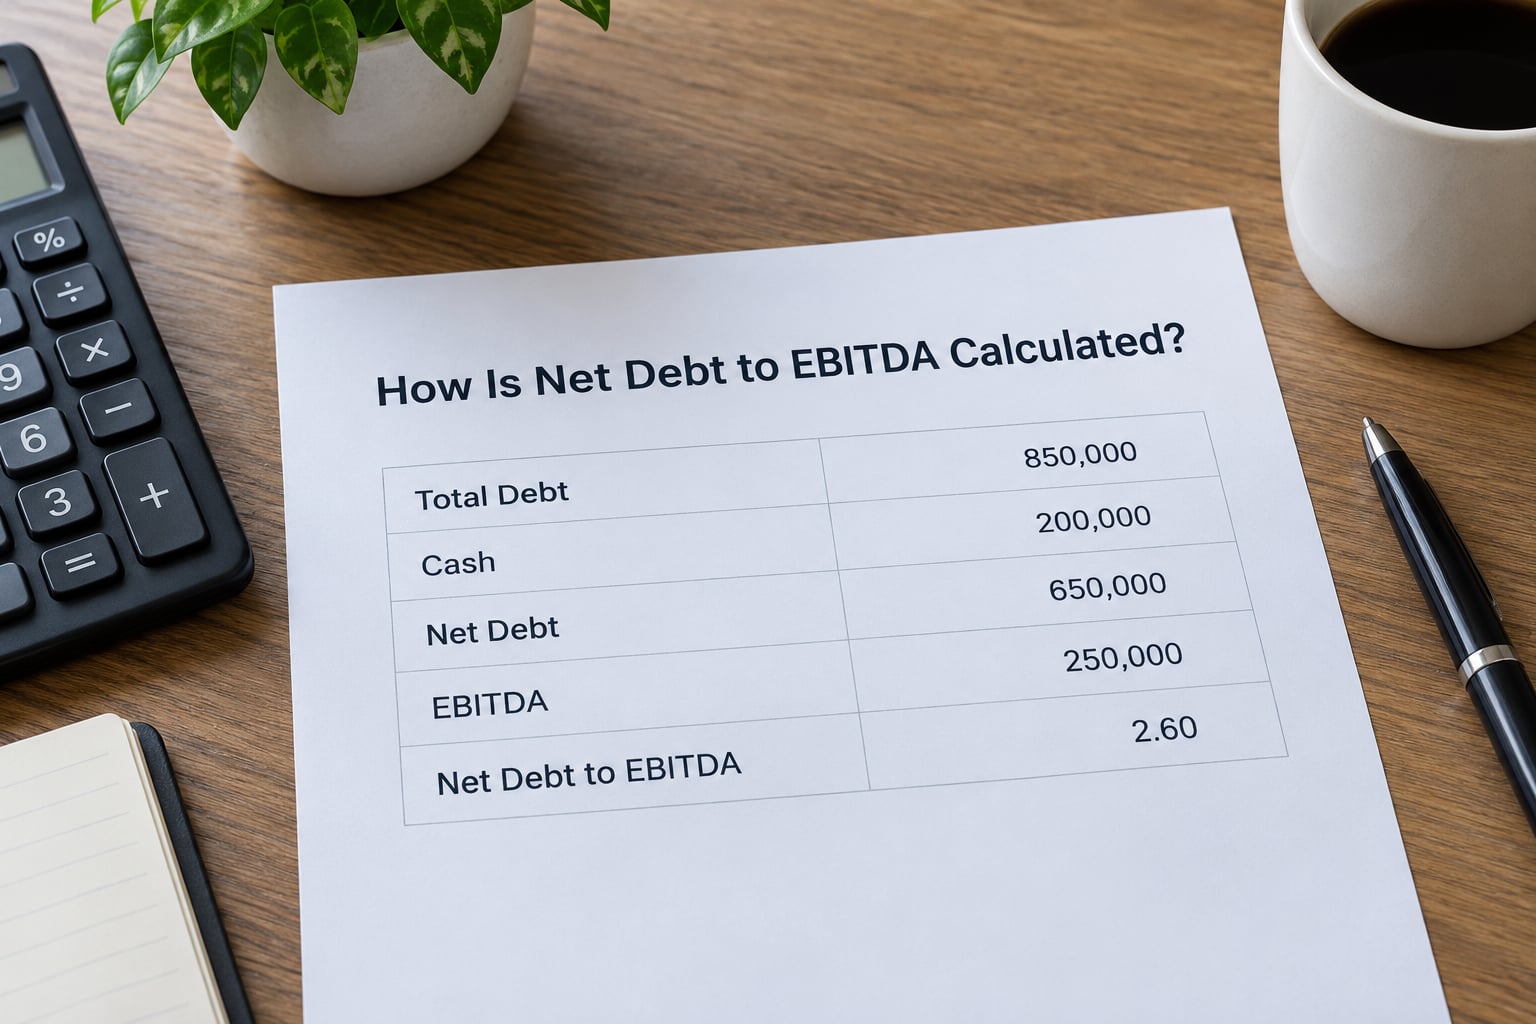
The numerator, net debt, usually looks like this:
Net debt = short-term borrowings + current portion of long-term debt + long-term debt + finance lease obligations − cash and cash equivalents − short-term investments
The denominator is EBITDA, expanded as earnings before interest, taxes, depreciation and amortization. Start from operating profit and add back depreciation and amortization to get a figure that reflects earnings before capital structure and tax. Most data providers and most lenders use trailing twelve months EBITDA so the ratio reflects a full operating cycle rather than one quarter.
Net Debt to EBITDA Formula and Worked Example
Here is an illustrative manufacturer, Harbour Point, with round numbers so you can follow the arithmetic. Nothing here comes from a real filing; it is simply a worked case.
| Input | Amount (millions) |
|---|---|
| Short-term borrowings and current maturities | 180 |
| Long-term debt | 1,270 |
| Finance lease obligations | 50 |
| Total interest-bearing debt | 1,500 |
| Cash and cash equivalents | (300) |
| Net debt | 1,200 |
| Trailing twelve months EBITDA | 400 |
| Net debt to EBITDA | 3.0x |
So 1,200 divided by 400 gives exactly 3.0. Read that as: at current earnings, three full years of EBITDA would clear everything net of cash. If EBITDA fell by a third and stayed there, the same balance sheet would take nine years to work down.
Now the second case, a software company called Fairlight Systems. It carries 200 million of debt but holds 650 million in cash and short-term investments, so net debt is negative 450 million. EBITDA is 300 million. The result is negative 1.5x.
That number is not a warning sign. It means the company holds more cash than debt and could in theory clear every obligation outright. Most newcomers read a negative result as danger and it is quite the reverse.
One more practical note on sourcing the numbers. Short-term borrowings sit in current liabilities, long-term debt sits in the non-current section, and cash sits in current assets, usually as cash and cash equivalents on the balance sheet face. EBITDA is not a reported line item, so you add back depreciation and amortization from the cash flow statement to operating profit. A press release will usually hand you adjusted EBITDA directly, which saves the work but comes with a caveat covered below.
How Do Investors Interpret the Ratio?
Below roughly 1x a company could clear its net debt inside a year of current earnings, and above 3x the number of years required passes the point where a single weak year starts to matter.
| Result | What it usually signals |
|---|---|
| Negative | Net cash position; debt is more than covered by cash on hand |
| Below 1.0x | Very strong capacity to absorb a downturn; common in profitable software firms |
| 1.0x to 3.0x | Comfortable and typically investment grade territory |
| 3.0x to 4.5x | Manageable but sensitive; covenants often start to bite in this band |
| Above 4.5x | Limited room for error; likely reliant on refinancing or continued cash generation |
The trend matters as much as the level. A company going from 4.2x to 3.1x while its EBITDA stays flat is deleveraging honestly and improving its position. One that slides from 1.8x to 3.4x because earnings collapsed has the same ratio with the opposite meaning, and a credit committee would read those two very differently.
Rising capex also flatters the ratio without any change in the balance sheet. Money moved from cash into plant and equipment raises net debt while EBITDA stays put for now, so a heavy build-out year can push the ratio above a covenant limit even though nothing has gone wrong.
What Is a Good Net Debt to EBITDA Ratio?
There is no universal good number, because the same 4x means very different things in a regulated utility with 30-year asset lives and a junior exploration company with one unproven prospect.
What makes a number defensible is the comparison set: the same company’s own history, the sector’s typical range, and the stability of the earnings underneath it. A recurring, contracted EBITDA stream supports debt that a cyclical one cannot.
| Sector | Typical range | Why |
|---|---|---|
| Mining and resources (mid-cycle) | 1.5x to 3.0x | Cash flow swings hard with commodity prices, so lenders size debt off mid-cycle rather than peak earnings |
| Utilities and regulated networks | 4.0x to 6.0x | Predictable regulated income and very long-lived assets support higher debt |
| Telecom | 2.5x to 4.0x | Heavy spectrum and network spending, offset by stable subscriber revenue |
| Industrials and manufacturing | 2.0x to 3.5x | Order books move, so lenders want a visible margin of safety |
| Retail and consumer | 2.0x to 3.5x | Thin margins mean small earnings drops hurt debt service quickly |
| Software and subscription businesses | Net cash or below 1.0x | Little physical capital needed, so debt is usually optional |
| Banks and insurers | Not used | Debt is a raw material here; capital ratios and liquidity coverage replace this measure |
For resource companies specifically, the honest question is whether EBITDA was measured in the middle of the price cycle or at the top of it. A producer earning elevated margins reports a fat denominator and a comfortable ratio just as copper is heading down. Using a mid-cycle price deck changes the answer completely, and analysts frequently quote deleveraging targets on that basis, such as a stated goal of moving from around 3.5x toward 3x, or a recapitalisation target near 1x.
Resource analysts also track the absolute change in net debt alongside the ratio. A business that cut net debt from 142.1 million to 33.1 million in a single year has made real progress that a ratio alone can blur if EBITDA moved at the same time.
Net Debt to EBITDA Versus Other Leverage Ratios
Each gearing measure answers a different question, and confusing them is the most common error readers make. Picking the wrong one puts you on the wrong threshold bands.
| Ratio | What it measures | Where it misleads |
|---|---|---|
| Net debt to EBITDA | Years of core operating earnings needed to repay net debt | Ignores cash taxes, working capital and capital expenditure |
| Gross debt to EBITDA | Same idea without netting cash off | Overstates position for businesses sitting on large cash piles |
| Debt to equity | Borrowings against book value of owners’ equity | Book equity moves with revaluations and buybacks, so the ratio drifts without any new debt |
| Debt to capital | Borrowings against total capital | A ratio asked about as a percentage usually means this, not the EBITDA version |
| Interest coverage | Operating profit available to pay interest | Says nothing about the size of the debt principal being repaid |
| Net debt to equity | Net borrowing against book equity | Useful in asset-heavy sectors, weak where assets are intangible |
Net debt to EBITDA wins on one point the others cannot match: it is written into contracts. Bank credit agreements routinely cap the ratio at something like 3.5x, defined with their own adjusted EBITDA and sometimes with a carve-out for acquisitions and disposals. That is why a company can be profitable, cash-generative and still be in breach.
A credit agreement also defines what counts as debt far more broadly than the balance sheet does. Pension deficits, guarantees, receivables sold and certain lease obligations often come in. Reading the definitions in the notes before signing off on a headline figure takes a few minutes and regularly changes the answer.
What Can Make the Ratio Look Better or Worse?
The number moves for reasons that have nothing to do with the underlying business, and separating signal from noise is the analytical work.
Adjusted EBITDA add-backs. Management-defined adjusted EBITDA can include restructuring charges, stock compensation, impairments, unrealized FX movements and acquisition costs, sometimes repeatedly for several years running. Each add-back grows the denominator and flatters the ratio. Comparing a company that reports adjusted EBITDA against one that reports the plain version is comparing two different things.
Restricted and trapped cash. Cash held in escrow, pledged against debt, or sitting in jurisdictions where it cannot be repatriated without penalty does not service debt. An analyst blog examining Telia made exactly this point, arguing that cash restricted for ordinary operations cannot be used for ongoing debt service. If you net the full cash balance, the ratio will look better than the credit reality.
Acquisitions. Buying a company raises debt and brings the target’s earnings with it, so the ratio can improve immediately even though borrowing increased. Read covenant definitions carefully here, because most agreements set a higher permitted step-up for a year after a permitted acquisition.
Asset sales and disposals. Selling a business generates cash that pays down debt, reducing net debt while removing the EBITDA that came with it. The ratio may move in either direction.
Leases and minority interests. IFRS 16 already brings most lease liabilities onto the balance sheet, but US GAAP reporting and covenant definitions can differ. Non-controlling interests in subsidiaries are sometimes treated as debt-like when the parent has an obligation to buy them out.
Currency and commodity prices. A producer earning in dollars but reporting in another currency moves with the exchange rate, and commodity price moves change EBITDA far faster than debt.
How to Use Net Debt to EBITDA in Company Analysis
Run the ratio over several years, not one quarter, and treat the covenant definition as the version that matters if you are worried about distress.
Here is the sequence I use.
1. Pull net debt from the filings, not a summary site. Start with the balance sheet: short-term borrowings plus current maturities, plus long-term debt, plus finance leases, minus cash and cash equivalents. Check the notes for restricted cash and for debt-like items the face of the balance sheet omits.
2. Build trailing twelve months EBITDA yourself. Take operating profit for the year and add back depreciation and amortization from the cash flow statement. If you only have four quarterly press releases, sum the last four adjusted EBITDA figures and note that the definition may have changed mid-year.
3. Plot the trend against the covenant limit. A company at 3.2x against a 3.5x covenant has 0.3x of headroom, which on 400 million of EBITDA is about 120 million of net debt. That is a thin buffer if earnings are falling.
4. Compare EBITDA with operating cash flow. A gap that persists means working capital or cash taxes are eating the earnings the ratio assumes are available.
5. Check capital expenditure against debt maturities. For a resource company, a mine that needs sustained spending while debt matures in two years is a different credit than one with a funded build plan.
6. For cyclicals, rerun the calculation on mid-cycle prices. This is the single most useful adjustment for miners and producers, and it regularly reverses the conclusion.
Used this way, the ratio is a screening filter that tells you which companies deserve a closer read. It is not a standalone buy signal, and no one sensible trades on it alone.
Frequently Asked Questions
Most lenders treat 1x to 3x as comfortable, 3x to 4.5x as acceptable but sensitive, and above 4.5x as thin. There is no universal good number, because the right band depends on the stability of earnings and how capital intensive the business is. Compare a company against its own history and against peers in the same sector rather than against a single global threshold.
Add short-term borrowings, current maturities of long-term debt, long-term debt and finance leases together, then subtract cash and cash equivalents to reach net debt. Divide that figure by trailing twelve months EBITDA, calculated as operating profit plus depreciation and amortization. All the inputs appear on the balance sheet and the cash flow statement.
Yes. A negative result means the company holds more cash and short-term investments than it owes, so it could retire every obligation without raising money. Software businesses and cash-rich commodity producers often sit here. Newcomers sometimes read a minus sign as distress, and it means the opposite of distress.
Negative EBITDA is unambiguously bad, because it means the core business consumes cash before any interest, tax, depreciation or amortization. The net debt to EBITDA ratio cannot be calculated in that situation, since there is no positive denominator. Analysts switch to absolute burn rate, cash runway in quarters, and the size of the cash balance instead.
Long-lived assets and predictable cash flows let a company service more debt than a volatile business could. A mature utility with 30-year asset lives may carry 5x without strain, while a junior explorer at 3x may be stretched. The high ratio is a deliberate structural choice, not necessarily a warning sign, provided the earnings are dependable.
Buffett has been openly sceptical of EBITDA, arguing that it excludes the capital a business must spend simply to stay in business and that management can adjust it to flatter results. The practical takeaway for analysis is to distrust heavily adjusted figures and to cross-check EBITDA against capital expenditure and operating cash flow before treating a ratio built on it as meaningful.
Conclusion
Net debt to EBITDA is one formula: interest-bearing debt minus cash, divided by earnings before interest, tax, depreciation and amortization. Read it as years of core earnings needed to clear the debt, then read it against the company’s own history and its sector rather than a universal cutoff.
Start by opening the latest annual and quarterly reports, pulling total debt and cash off the balance sheet, and adding back depreciation and amortization to reach EBITDA. Work out the ratio for three or four periods, note the covenant limit if one exists, and if the business is cyclical, rerun the arithmetic on mid-cycle prices before you trust the result.
Source: https://www.pgm-blog.com/what-is-net-debt-to-ebitda/
Anyone can join.
Anyone can contribute.
Anyone can become informed about their world.
"United We Stand" Click Here To Create Your Personal Citizen Journalist Account Today, Be Sure To Invite Your Friends.
Before It’s News® is a community of individuals who report on what’s going on around them, from all around the world. Anyone can join. Anyone can contribute. Anyone can become informed about their world. "United We Stand" Click Here To Create Your Personal Citizen Journalist Account Today, Be Sure To Invite Your Friends.
LION'S MANE PRODUCT
Try Our Lion’s Mane WHOLE MIND Nootropic Blend 60 Capsules
Mushrooms are having a moment. One fabulous fungus in particular, lion’s mane, may help improve memory, depression and anxiety symptoms. They are also an excellent source of nutrients that show promise as a therapy for dementia, and other neurodegenerative diseases. If you’re living with anxiety or depression, you may be curious about all the therapy options out there — including the natural ones.Our Lion’s Mane WHOLE MIND Nootropic Blend has been formulated to utilize the potency of Lion’s mane but also include the benefits of four other Highly Beneficial Mushrooms. Synergistically, they work together to Build your health through improving cognitive function and immunity regardless of your age. Our Nootropic not only improves your Cognitive Function and Activates your Immune System, but it benefits growth of Essential Gut Flora, further enhancing your Vitality.

Our Formula includes: Lion’s Mane Mushrooms which Increase Brain Power through nerve growth, lessen anxiety, reduce depression, and improve concentration. Its an excellent adaptogen, promotes sleep and improves immunity. Shiitake Mushrooms which Fight cancer cells and infectious disease, boost the immune system, promotes brain function, and serves as a source of B vitamins. Maitake Mushrooms which regulate blood sugar levels of diabetics, reduce hypertension and boosts the immune system. Reishi Mushrooms which Fight inflammation, liver disease, fatigue, tumor growth and cancer. They Improve skin disorders and soothes digestive problems, stomach ulcers and leaky gut syndrome. Chaga Mushrooms which have anti-aging effects, boost immune function, improve stamina and athletic performance, even act as a natural aphrodisiac, fighting diabetes and improving liver function. Try Our Lion’s Mane WHOLE MIND Nootropic Blend 60 Capsules Today. Be 100% Satisfied or Receive a Full Money Back Guarantee. Order Yours Today by Following This Link.


| Visits: | 1,834,080,909 |
| Stories: | 8,716,238 |
Whistler Blowers, Insiders

