
Why High Dividend Yields Can Be a Trap: A Guide (October 2026)

Why high dividend yields can be a trap is mostly a question of what sits in the denominator. A yield of 15 percent usually means the share price has fallen, not that the company decided to be generous, and the payout is often being financed with debt or a one-off cash pile. Buy the yield and you are buying a business that has already told you its earnings are falling apart.
This is general educational information, not investment advice. Nothing here is a recommendation to buy or sell any security, and rules, tax treatment and market conditions change, so check the details yourself before acting.
I keep coming back to one number: the price fell faster than the dividend. Everything else on this page is a way of testing that claim.
Why high dividend yields can be a trap
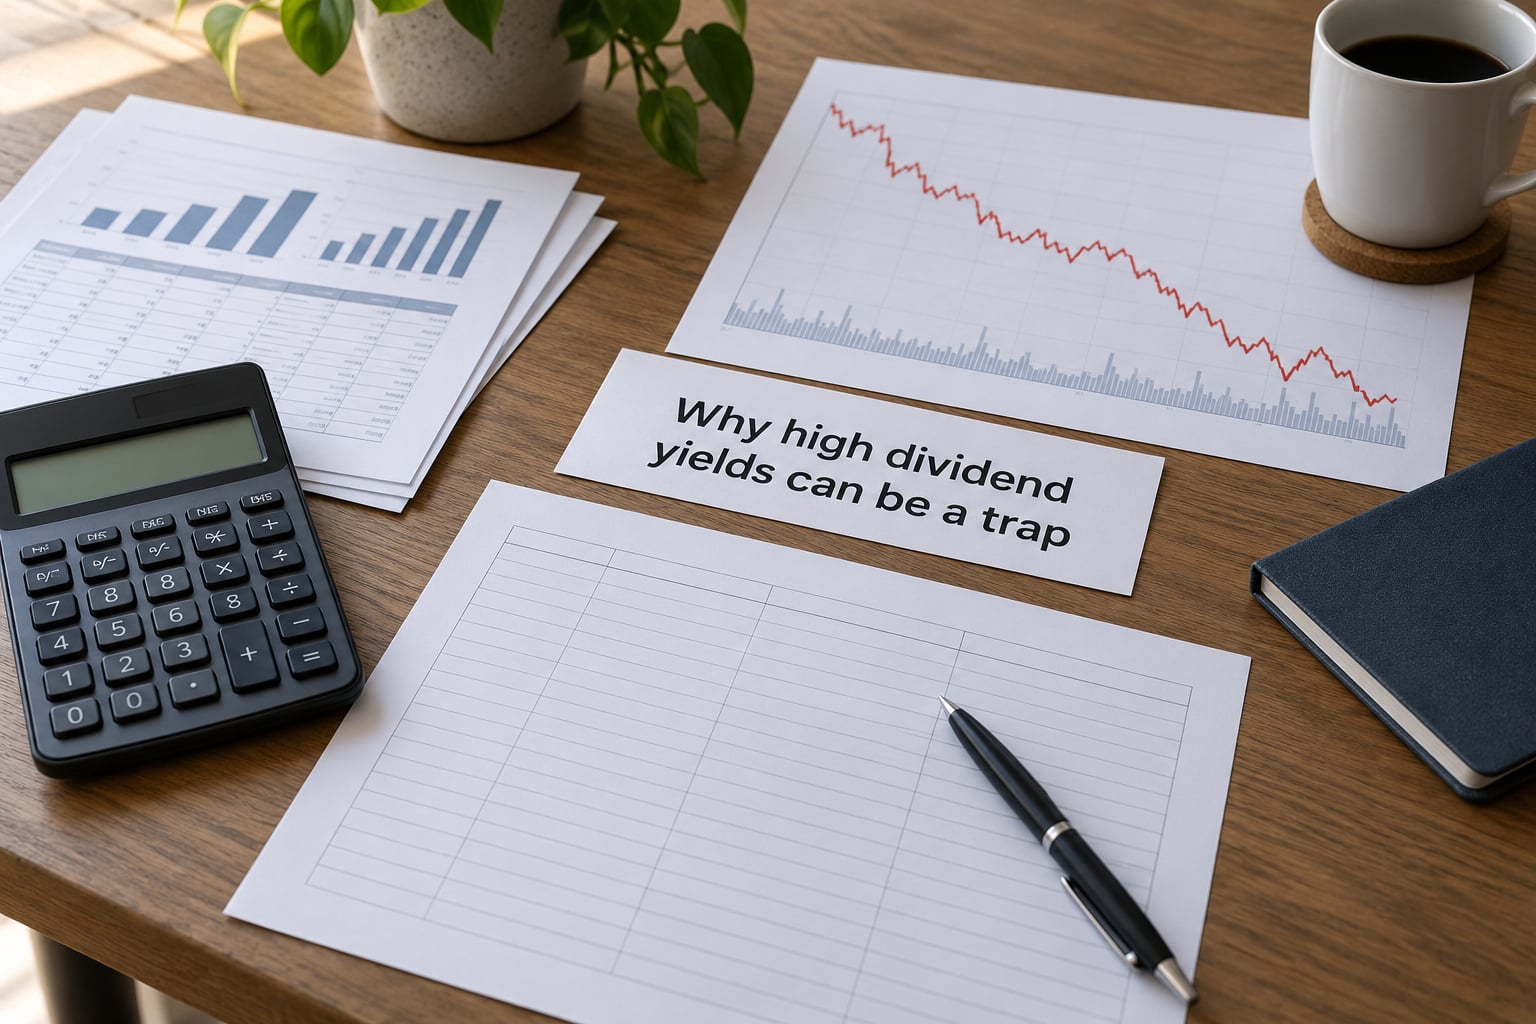
Dividend yield is a backward-looking ratio built from two numbers: what the company paid out and what the share costs today. Because the price sits on the bottom of the fraction, any sharp drop in that price inflates the yield mechanically. The income did not grow. The price collapsed.
That is the whole trap in one line, and it reverses the logic most people bring to income investing. A buyer reads a 12 percent yield as “a lot of money for me,” when the more accurate reading is “the market has repriced this business downward and the current dividend is almost certainly unsustainable.”
A dividend trap is any share whose headline yield is high because its price has fallen faster than its payout, and whose business cannot generate the cash to keep paying. The payout gets cut, the income shrinks, and the price usually drops again as the yield buyers leave. You lose the dividend and the capital at the same time.
High yield means total return, not income
Suppose you buy 1,000 shares at 100 dollars, a 15 percent yield, so 15,000 dollars a year in dividends. If the business deteriorates and the price falls to 20 dollars while the dividend is cut to zero, the capital loss is 80,000 dollars against five years of dividends at best. The income never stood a chance.
Income investors tend to watch the dividend column and ignore the price column. Those are the two columns that matter together.
How dividend yield is calculated
Dividend yield equals annual dividend per share divided by the current share price, expressed as a percentage. To solve for dividend yield, take the four quarterly dividends, add them together, and divide by the share price.
Worked example: a company pays 0.25 dollars a quarter, so 1.00 dollar a year. At a 40 dollar share price the yield is 2.5 percent. At a 20 dollar price it is 5 percent. The dividend never changed. The yield doubled.
| Share price | Annual dividend per share | Dividend yield | What likely happened |
|---|---|---|---|
| 40 dollars | 1.00 dollar | 2.5% | Business performing normally |
| 28 dollars | 1.00 dollar | 3.6% | Mild concern, payout still covered |
| 16 dollars | 1.00 dollar | 6.3% | Price halved while payout held, cover is eroding |
| 10 dollars | 1.00 dollar | 10.0% | Distress. The cut is usually announced within a few quarters |
Two other things move the number. A newly announced increase lifts the numerator, though a company that raises its payout during a downturn is often the one about to trim it. And a one-off special dividend, a large asset sale or a tax refund can spike the trailing figure for a single year and then vanish.
What makes a high yield dangerous?
Here are the eight warning signs, with the arithmetic attached so you can reproduce each one from a filing.
1. An earnings payout ratio above 100 percent
Earnings payout ratio is annual dividend per share divided by earnings per share. A company earning 1.00 a share and paying 1.20 is distributing more than it earns, and the shortfall has to come from the balance sheet or a credit line. Anything sustained above roughly 80 percent on a mature business is a thin cushion.
2. A free cash flow payout ratio above 100 percent
This is the check almost every screener skips. Earnings are an accrual measure; cash is what actually reaches the shareholders’ bank accounts. Take net income of 1.20 a share, subtract 400 million dollars of capital spending, and free cash flow can fall to 700 million while the dividend bill is 900 million.
A company showing 60 percent on earnings and 130 percent on cash is paying out of the balance sheet while telling you it is covered. When working capital normalises, the cash number collapses.
3. Dividends funded by debt
Check net debt to EBITDA, debt-to-equity and interest coverage. Debt-to-equity above 2 for anything that is not a regulated utility or a landlord is a warning, and interest coverage under 3 means a small earnings wobble turns into a covenant conversation. Borrowing to pay shareholders is not a dividend policy, it is a delayed expense.
4. Earnings that only look strong at the top of the cycle
Energy, shipping, commodity producers and mining royalty companies earn peak-cycle profits and pay them out as if they are normal. The payout ratio looks conservative at the top and catastrophic at the bottom, and the bottom always arrives.
5. Dependence on one commodity or one asset
A single mine, a single field or a single credit book means the dividend is a bet on a price, not on an operation. When that price moves against you, the payout has no other leg to stand on.
6. Share count rising faster than the dividend
Issuing shares to hold the per-share dividend flat is a quiet cut. Watch basic shares outstanding across several filings; a payout that only appears stable because the denominator keeps expanding is not stable.
7. A payout above what the company has ever paid
If the current dividend is more than double the five-year average and management is framing it as permanent, ask what one-time cash made it possible. An asset sale, a litigation settlement or a working capital release all produce exactly this shape.
8. Yield distorted by the rate cycle
The decade of near-zero rates pushed money out of bonds and into anything labelled income, which compressed prices and stretched yields across whole sectors. When the rate backdrop normalises, the income you were chasing becomes the least interesting part of the return.
The difference between a high yield and a high-quality dividend
Yield measures how much cash arrives per share bought. Dividend quality measures whether that cash is going to keep arriving. They come apart constantly, and the table below is the comparison I run before anything else.
| Signal | High yield from distress | High yield that is sustainable |
|---|---|---|
| Share price trend | Down 40 percent or more over a year | Flat to rising, or one dip that recovers |
| Free cash flow payout | Above 100 percent | Below 70 percent with room in bad years |
| Net debt to EBITDA | Rising, or above 4x | Stable or falling |
| Dividend history | Frozen for years, then trimmed | Growing, with a multi-year streak |
| Revenue and EPS | Both declining | Flat at worst |
| Share count | Expanding to hold the payout flat | Flat or shrinking |
| Business type | Cyclical commodity or levered finance | Mature, essential, asset-backed |
| Reason you found it | It showed up on a top-yielders screen | You read the cash flow statement |
The last row matters most. A lot of high-yield lists are built by sorting a database on one field, which means the list is a ranking of distress, not of quality. If you cannot articulate how you found the share beyond “it was high on a list”, you have not done the work yet.
How to check whether a dividend can survive a downturn
Five checks, in order, and none of them require a spreadsheet. Open the most recent 10-K or 10-Q and the dividend announcement history on the company investor page.
- Read the payment record back five to ten years. Look for increases, freezes and cuts. A single cut in the history tells you management will cut under pressure; two or three tells you this is a cyclical payer being treated as a bond proxy.
- Find free cash flow in the cash flow statement. Operating cash flow minus capital spending, then divide by the total dividend paid. This single ratio will disqualify more traps than any other.
- Look at the debt and the interest bill. Debt-to-equity, net debt to EBITDA and interest coverage, with the maturity schedule from the filing notes.
- Stress the earnings against a bad year. Take the worst revenue year in the last decade, apply that margin, and ask whether the dividend still fits. For a commodity producer, use a commodity price well below the last five-year average.
- Read what management does with capital. A company that raises the dividend while cutting capital spending and letting debt climb has chosen the payout over the future of the business.
How it looked in practice, using dated historical examples rather than predictions. In 2022 AT&T cut its dividend for the first time in more than a decade after heavy spending on fibre. In 2024 Walgreens Boots Alliance cut its payout sharply to cover debt taken on for acquisitions. In 2024 3M reduced its dividend as it worked through litigation liabilities. Each one had a high trailing yield in the months before the announcement, and each one had a payout ratio that made the risk visible in advance.
The mortgage REIT examples are the starkest. Figures reported by Benzinga in 2022 put Orchid Island Capital moving from a 14.50 dollar IPO price to about 2.88 dollars while its monthly dividend fell from 0.135 to 0.045 dollars, and Office Properties Income Trust falling from roughly 48 dollars in 2018 to about 18 dollars while still paying double-digit yield throughout. Investors who collected the distributions throughout still ended up far behind, which is the clearest illustration of the point: a dividend received does not offset a capital loss.
A simple dividend-stock checklist before you invest
Before you buy, run five numbers. They take a few minutes each and the ratios are the same for every company.
- Dividend yield. Annual dividend per share divided by share price. Know the number, but treat it as the starting question rather than the answer.
- Earnings payout ratio. Dividend per share divided by EPS. Above 80 percent on a mature business is thin; above 100 percent is a funded payout.
- Free cash flow payout ratio. Total dividends paid divided by free cash flow. Above 100 percent means the dividend is being financed from the balance sheet.
- Net debt to EBITDA. Above 4x or climbing fast is a warning outside of lenders and landlords.
- Dividend growth streak. How many consecutive years of increases. A long streak is the single best counter-signal to a yield trap, because management is signalling confidence in the cash flow.
| Number | Formula | Comfortable | Red flag |
|---|---|---|---|
| Dividend yield | Annual dividend / share price | 2 to 5 percent | Double digits with falling revenue |
| Earnings payout | Dividend per share / EPS | Under 60 percent | Over 100 percent |
| FCF payout | Dividends paid / free cash flow | Under 70 percent | Over 100 percent |
| Net debt to EBITDA | (Debt less cash) / EBITDA | Under 2x | Over 4x or rising |
| Growth streak | Consecutive years of increases | 10 years or more | Zero, with a flat payout |
Two more checks that cost nothing. Confirm your own concentration: a single company paying you 15 percent of what you need each year is a job, not a portfolio, and one cut changes your plan. And read the dividend declaration calendar so you know when the next declaration lands, because that is when the market finds out whether the payout holds.
Compare any candidate against what you would earn reinvesting. A 3 percent yield that grows 10 percent a year reaches a higher yield on cost within about seven years than a 15 percent yield that gets cut and reset. Yield-on-cost is the honest measure of a payout that is actually being maintained.
Where high dividend yields can be useful
Not every high yield is a distress signal. Some business models are required to distribute most of their profit, so a high payout is normal rather than dangerous.
- REITs. To retain tax-exempt status a REIT must distribute most of its taxable income, which pushes payout ratios well past what a normal company would tolerate. Judge them on funds from operations, payout against that measure, net debt to EBITDA and the debt maturity ladder.
- Mortgage REITs. Structurally higher yielding and structurally more fragile, because the income comes from a leveraged spread that compresses when rates move. The 2022 examples above are the pattern to study, not an outlier.
- Master limited partnerships and BDCs. Similar structure, similar obligation to distribute. Watch coverage against distributable cash flow rather than earnings, and check what happens to distributions in a credit downturn.
- Asset-rich businesses with no reinvestment runway. A mature pipeline, a licensed network or a depleted field has little to reinvest in, so distributing the cash is the sensible choice. The question is how many years of reserves remain.
The test for all four is the same. Confirm the cause of the high yield, then confirm it survives a bad year. A temporarily depressed price on a sound asset-rich business is an opportunity; a structurally declining one is a coupon that gets cut.
Frequently Asked Questions
Because the share price sits in the denominator of the yield formula, a collapsing price inflates the yield without any increase in income. That high yield is usually a distress signal: the payout is being covered by debt, by the balance sheet or by a one-off cash inflow, none of which repeat. When the company cuts the dividend, investors lose the income and the price typically falls again at the same time.
A dividend trap is a share whose headline yield is high because its price has fallen faster than its payout, and whose business cannot produce the cash to keep paying. The pattern is a frozen or stretched payout, weak free cash flow, and a cut that arrives within a few quarters of the investor buying on the strength of the yield.
It is a guideline from the 1950s investment research tradition stating that a company should not pay out more than about a quarter of its net income as dividends, leaving the rest for reinvestment and a cash buffer. Most mature public companies sit far above it, so treat it as context rather than a screen. The more useful question is whether free cash flow covers the payout after capital spending.
Buffett has consistently argued that a dividend should be a by-product of a good business rather than a reason to buy one, and that companies retaining cash only to pay a bigger dividend are wasting shareholders’ money. He has criticised dividend-focused investors for holding low-quality payers and missing better opportunities, a view he set out plainly in his 2014 annual letter.
Add the four quarterly dividends to get the annual dividend per share, then divide by the current share price and multiply by 100. A 1.00 dollar annual dividend on a 40 dollar share price is a 2.5 percent yield. On a 20 dollar share price the same dividend is 5 percent, which is how a falling price creates a high yield without any change in the payout.
At a 3 percent yield you need roughly 1.67 million dollars of invested capital, at 6 percent about 833,000 dollars, and at 10 percent around 500,000 dollars. The higher yield looks efficient and concentrates your income in the most fragile businesses, so the arithmetic that looks best on paper usually carries the most risk.
Conclusion: start with the business, not the yield
The reason high dividend yields can be a trap is that the yield is a ratio, not a verdict, and the price is the half that moves. Read free cash flow against the payout, check the debt behind it, and look at what the share price has been doing for a year before you look at what the dividend is paying.
One practical first step: take the highest-yielding name on your list and spend ten minutes in its cash flow statement. If the dividend is not covered by free cash flow after capital spending, you have your answer before you buy anything.
Source: https://www.pgm-blog.com/why-high-dividend-yields-can-be-a-trap/
Anyone can join.
Anyone can contribute.
Anyone can become informed about their world.
"United We Stand" Click Here To Create Your Personal Citizen Journalist Account Today, Be Sure To Invite Your Friends.
Before It’s News® is a community of individuals who report on what’s going on around them, from all around the world. Anyone can join. Anyone can contribute. Anyone can become informed about their world. "United We Stand" Click Here To Create Your Personal Citizen Journalist Account Today, Be Sure To Invite Your Friends.
LION'S MANE PRODUCT
Try Our Lion’s Mane WHOLE MIND Nootropic Blend 60 Capsules
Mushrooms are having a moment. One fabulous fungus in particular, lion’s mane, may help improve memory, depression and anxiety symptoms. They are also an excellent source of nutrients that show promise as a therapy for dementia, and other neurodegenerative diseases. If you’re living with anxiety or depression, you may be curious about all the therapy options out there — including the natural ones.Our Lion’s Mane WHOLE MIND Nootropic Blend has been formulated to utilize the potency of Lion’s mane but also include the benefits of four other Highly Beneficial Mushrooms. Synergistically, they work together to Build your health through improving cognitive function and immunity regardless of your age. Our Nootropic not only improves your Cognitive Function and Activates your Immune System, but it benefits growth of Essential Gut Flora, further enhancing your Vitality.

Our Formula includes: Lion’s Mane Mushrooms which Increase Brain Power through nerve growth, lessen anxiety, reduce depression, and improve concentration. Its an excellent adaptogen, promotes sleep and improves immunity. Shiitake Mushrooms which Fight cancer cells and infectious disease, boost the immune system, promotes brain function, and serves as a source of B vitamins. Maitake Mushrooms which regulate blood sugar levels of diabetics, reduce hypertension and boosts the immune system. Reishi Mushrooms which Fight inflammation, liver disease, fatigue, tumor growth and cancer. They Improve skin disorders and soothes digestive problems, stomach ulcers and leaky gut syndrome. Chaga Mushrooms which have anti-aging effects, boost immune function, improve stamina and athletic performance, even act as a natural aphrodisiac, fighting diabetes and improving liver function. Try Our Lion’s Mane WHOLE MIND Nootropic Blend 60 Capsules Today. Be 100% Satisfied or Receive a Full Money Back Guarantee. Order Yours Today by Following This Link.


| Visits: | 1,834,001,127 |
| Stories: | 8,715,728 |
Whistler Blowers, Insiders

