

What Is EBITDA and Why Investors Use It (October 2026)

EBITDA is earnings before interest, taxes, depreciation and amortization. It measures how profitable a company’s operations are before financing costs, taxes and the non-cash accounting charges of wear and write-off. Investors use it to compare businesses that carry very different debt loads, tax rates and asset bases on one common footing.
That is the whole idea in one sentence, and it answers what is EBITDA and why investors use it. Everything after this is about how the number is built, where it is useful, and where it quietly misleads. Last updated October 2026.
EBITDA = Net Income + Interest + Taxes + Depreciation & Amortization
EBITDA = Operating Income + Depreciation & Amortization
In a nutshell:
- EBITDA strips out financing, tax and accounting-policy choices, so two companies with identical operations can show very different net income and the same EBITDA.
- It is a non-GAAP measure, which means companies calculate and present it under their own rules.
- It ignores capital expenditure, working capital and debt repayment, so it is never the same thing as cash.
What Is EBITDA?
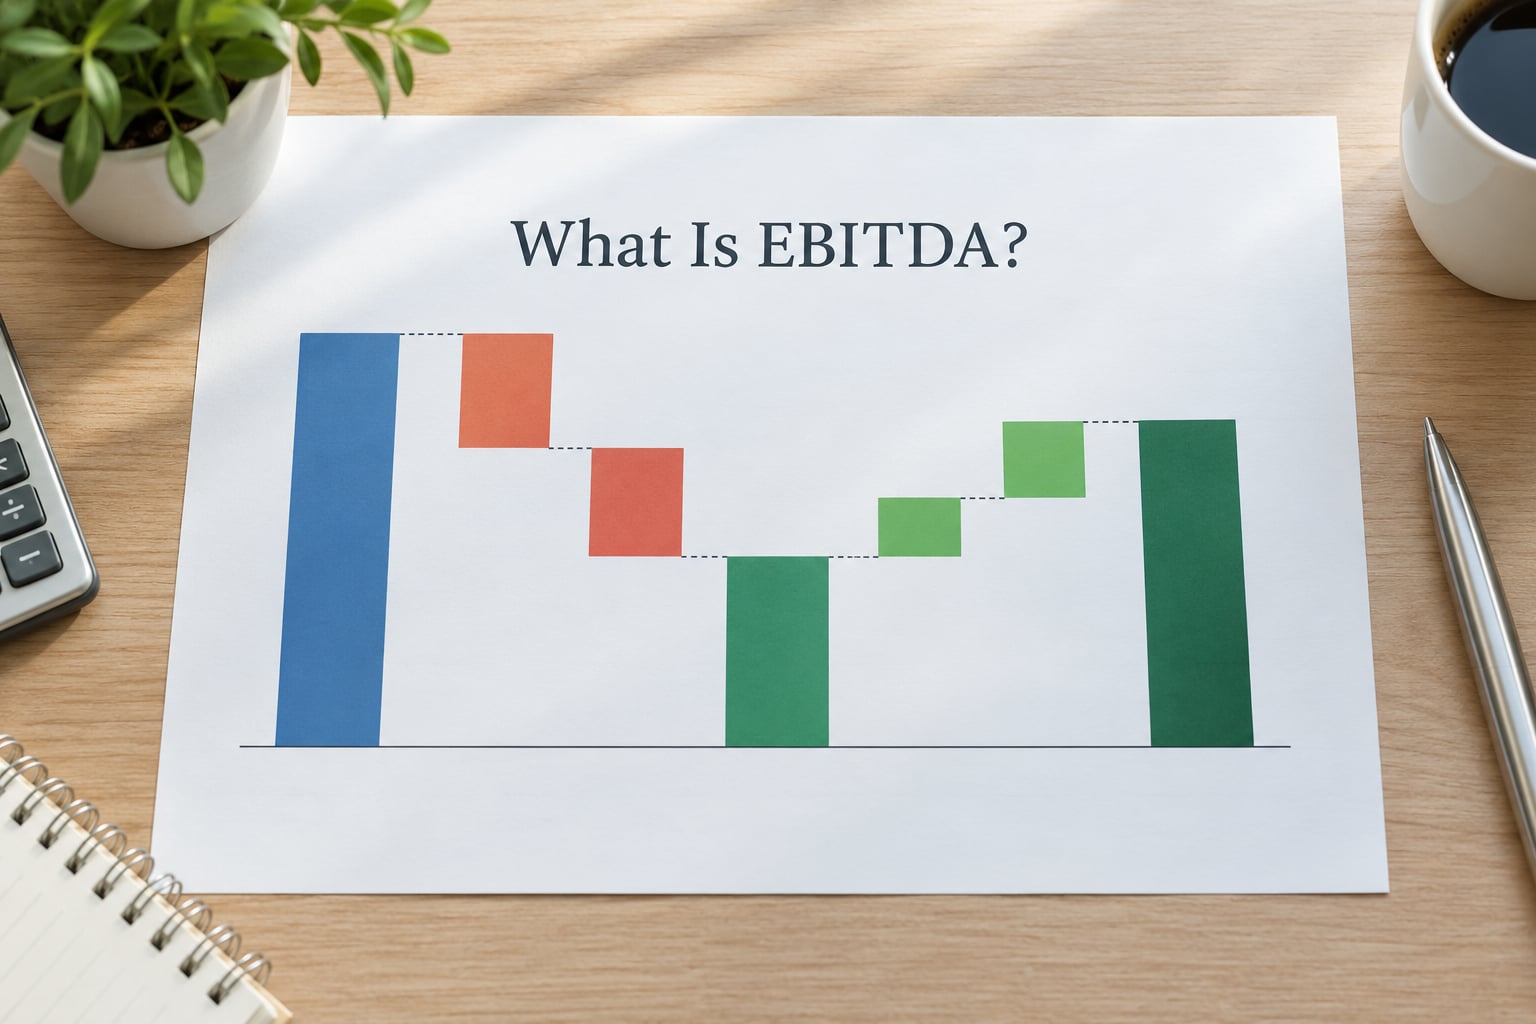
EBITDA is a standardized way of stripping a profit figure back to operating performance. Take net income, the bottom line after everything, and add back the four items in the acronym: interest expense, income taxes, depreciation and amortization. Interest and taxes are cash costs but belong to financing and jurisdiction rather than to running the business. Depreciation and amortization are the accounting recognition of assets wearing out or being written off, and they are non-cash in the period they are booked.
Strip those out and what remains is closer to what the operations earned before anyone decided how much debt to carry or which country to pay tax in. That is precisely the comparison investors want when they line up a capital-light software business against a mill, a pipeline or a mine.
Two caveats sit underneath the definition. First, EBITDA is not defined by GAAP or by the SEC. It is a non-GAAP measure, so when a company publishes it, it must also reconcile it back to the nearest GAAP measure. Companies that report adjusted EBITDA are using their own add-back rules, and those rules differ. Second, EBITDA is a measure of operating profitability, not a measure of cash generation, even though it is often described as one.
The metric also has a history worth knowing. It is generally traced to the 1970s, to the cable industry, where operators under John Malone’s Liberty Media used it to argue that heavy depreciation on newly built networks did not reflect the health of the business. Lenders in the 1980s leveraged buyout era adopted it as the basis for pricing debt, because interest coverage on EBITDA told them directly whether a target could service what they were about to lend. That origin explains both the enthusiasm and the discomfort: the metric was designed to argue past the cost of assets.
How Is EBITDA Calculated?
There are two routes to the same number, and knowing which one a company used tells you what you are looking at.
From net income. EBITDA = net income + interest expense + income tax expense + depreciation + amortization. This is the standard route and the one most data providers use, because every income statement has a net income line. Watch for interest income, which gets subtracted rather than added, and for taxes recorded as a benefit rather than a charge.
From operating income. EBITDA = operating income + depreciation + amortization. This is cleaner, because operating income already excludes interest and taxes. When the two routes produce different results, the gap usually comes from non-operating items sitting below the operating line.
Here is a single worked example that carries the figure all the way down to cash, which is the only way to see what EBITDA hides. The figures are in millions.
| Line | Amount |
|---|---|
| Revenue | 100.0 |
| Less cost of revenue | (62.0) |
| Gross profit | 38.0 |
| Less operating expenses | (21.0) |
| Operating income (EBIT) | 17.0 |
| Add back depreciation | 6.0 |
| Add back amortization | 1.5 |
| EBITDA | 24.5 |
| Less cash interest paid | (2.4) |
| Less cash taxes paid | (3.1) |
| Less capital expenditure | (9.8) |
| Less increase in working capital | (2.6) |
| Free cash flow | 6.6 |
Read the last five rows again. A business earning 24.5 million of EBITDA handed 6.6 million to its owners once it paid for the assets it used, the cash taxes it owed and the growth in its receivables and inventory. That gap is not a rounding issue. It is the difference between an accounting measure and a cash measure, and it is where a lot of bad acquisitions begin.
What Is EBITDA in a Ratio?
EBITDA on its own says little without scale. A 24.5 million figure is excellent for a software company and unremarkable for a steelmaker, so investors convert it into a margin: EBITDA divided by revenue, expressed as a percentage. In the example above, 24.5 divided by 100.0 is a 24.5% EBITDA margin.
The margin is what makes the number comparable. It strips out size and lets you ask whether each revenue dollar the business takes in leaves a quarter or a tenth of itself as operating profit before capital charges.
Is 30% EBITDA margin good? It depends entirely on the sector, which is why the universal rules of thumb that float around are so misleading. Approximate ranges, and treat them as starting points rather than targets:
| Sector | Typical EBITDA margin | What a 20/30/40% margin signals |
|---|---|---|
| Software and subscription services | 25-40%+ | Ordinary here. 40% suggests real pricing power at scale. |
| Professional and financial services | 15-25% | Strong. 30% would be top-quartile. |
| Manufacturing and industrial | 10-20% | 30% would be exceptional. Check whether assets are being leased rather than owned. |
| Mining, oil and gas | 10-40%, swinging with the commodity cycle | Read against the price deck. A peak-cycle 40% margin is not a run-rate. |
| Retail and consumer | 5-12% | 20% is exceptional. 40% almost always hides an add-back or a leasing structure. |
| Regulated utilities and pipelines | 30-50% | Normal, because the asset base is huge and the returns are capped. |
Two things are true at once: capital-intensive businesses naturally carry higher EBITDA margins, because their depreciation sits below the line, and their shareholder outcomes are not necessarily better for it. A utility earning a 45% EBITDA margin spends most of it back into the network. Benchmark the margin against peers in the same sector, then look at the trend and at where the cash went.
Why Do Investors Use EBITDA?
Investors use EBITDA for four practical reasons, and all four are about removing noise rather than adding insight.
- Capital-structure neutrality. Interest expense depends on how a company was financed, which is a decision made by the board or the lender, not by the operations. Two businesses with identical shops and identical margins show net income of 17.0 and 10.0 purely because one carries more debt. EBITDA shows both at 24.5. This is the intuition that comes up most often in investing forums, and it is the correct one.
- Tax and jurisdiction neutrality. A company operating in several countries pays a blended rate that has nothing to do with how well it runs. EBITDA removes that distortion, which matters when comparing across borders.
- Valuation multiples. Buyers pay a multiple of EBITDA. Enterprise value divided by EBITDA is the EV/EBITDA multiple, and because it pairs a whole-company value with a whole-company pre-financing profit, both sides are measured before debt. A business with 100 of EBITDA and 40 of net debt may sell for 600 of enterprise value and 560 of equity value. The same 6.0x multiple describes both.
- Debt serviceability. Lenders test EBITDA against interest expense, usually with a covenant requiring coverage of 2.0x to 3.0x or better. EBITDA is the numerator of that ratio because it is what the business can plausibly service debt with before asset spending. This is the number that decides whether a buyout is financeable at all.
The forecasting use is the quiet one. Project EBITDA, then deduct working capital, capital expenditure and cash taxes to reach unlevered free cash flow. Because the first step is standardised and published by every issuer, it is a cleaner starting point for a model than net income, where every company has made a different set of choices.
Forum consensus, from private equity, accounting and value investing discussions alike, is fairly consistent on this: EBITDA is a useful triage tool, not a verdict. Practitioners describe it as a rough steer on operating profitability and debt capacity. The mistake almost everyone flags is comparing EBITDA to net income as though the two are rivals. They are pre-financing and post-financing measures of the same business, and setting them against each other tells you only how much debt is on the books.
EBITDA vs. EBIT, Revenue, and Cash Flow
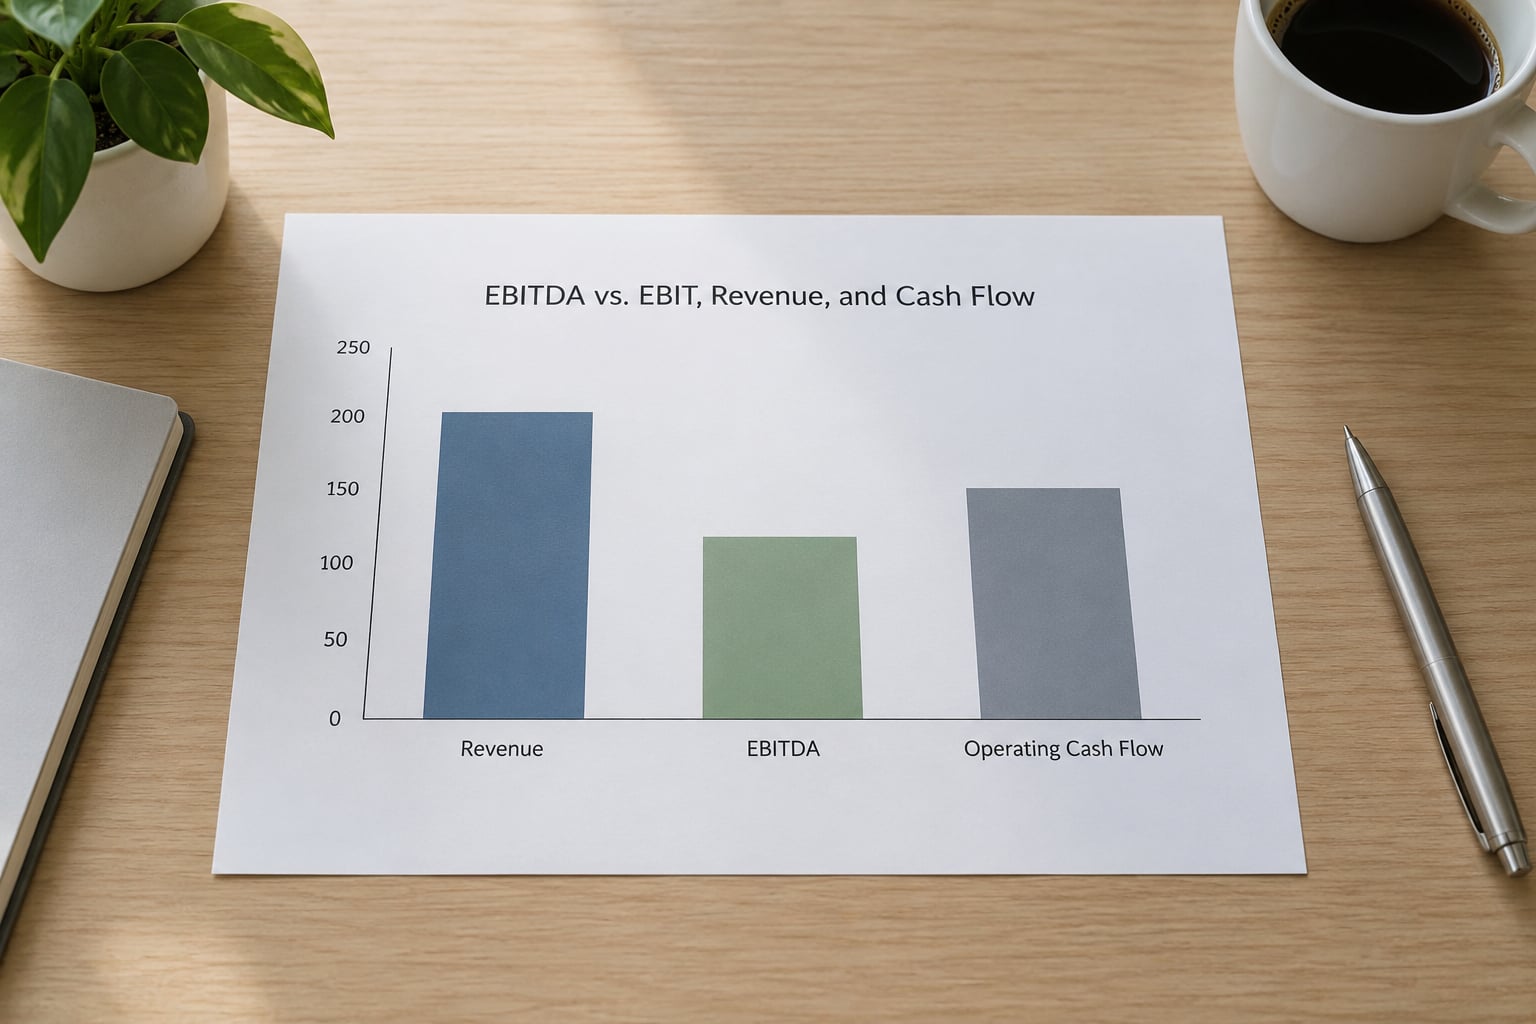
Investors rarely use EBITDA alone, which is why the comparisons matter more than the definition. Here is how the main measures stack up.
| Measure | What it includes | What it tells you | Where it misleads |
|---|---|---|---|
| Revenue | Everything the business bills | Scale and, with growth, trajectory | Says nothing about cost, capital intensity or profitability |
| EBITDA | Operations before interest, taxes, depreciation and amortization | Operating profitability, comparable across capital structures | Ignores asset spending, working capital and debt repayment |
| EBIT (operating income) | Operations after depreciation and amortization, before interest and tax | Profit after the cost of consuming assets | Depreciation is an accounting estimate, not a cash figure |
| EBT | Profit before tax, after interest | What is left after the cost of debt | Blends operating results with financing decisions |
| Operating cash flow | Cash actually generated by operations, after working capital | Whether the reported profit turned into cash | Affected by the timing of receivables, payables and inventory |
| Free cash flow | Operating cash flow less capital expenditure | What is genuinely available to owners and creditors | Volatile around heavy spending years, which makes it awkward as a valuation base |
So, is it better to use EBIT or EBITDA? For a capital-intensive business, EBIT is the more honest headline, because depreciation on a mine, a fleet or a pipeline reflects a recurring replacement need that EBITDA simply ignores. For an asset-light business, or for comparing two companies that differ mainly in leverage, EBITDA is more informative. The practical habit is to use both, plus free cash flow, and reconcile them.
And no, EBITDA is not free cash flow. In the worked example above, EBITDA of 24.5 became 6.6 of free cash flow. A company can post rising EBITDA while free cash flow falls, if capital spending rises faster or receivables stretch out. Whenever you see that pattern across several reporting periods, it deserves an explanation before you celebrate the earnings line.
Why Should Investors Be Careful With EBITDA?
The criticisms are not marginal complaints from accounting pedants. They are structural.
It ignores the cost of assets. EBITDA adds back depreciation, but the machines, mines and networks that depreciate have to be replaced eventually, and only someone pays for that. Warren Buffett’s line is that the tooth fairy does not pay for capital expenditures, and he has gone further, saying that references to EBITDA make us shudder. His preference is owner earnings, defined as reported earnings plus depreciation, amortization and other non-cash charges, less the average annual capital expenditure needed to keep the business running. That is closer to what shareholders actually receive.
It can be engineered through add-backs. Adjusted EBITDA strips out what a company calls one-time or non-recurring items: restructuring charges, legal settlements, impairments, stock-based compensation, sometimes whole acquisition costs. Some are genuinely one-off. Plenty are not, and the distinction is usually for the seller to make. WeWork’s 2018 filing publicised a measure it called Community Adjusted EBITDA, which subtracted real and recurring community operating costs. Sprint Nextel’s 2006 leveraged buyout showed the other failure mode, where a high multiple was paid against forecast EBITDA that the business never produced.
Accounting policy still leaks in. Depreciation schedules, useful-life assumptions, capitalization of software development and treatment of leases all sit either below or beside the EBITDA line, and companies with similar operations can still report meaningfully different figures. For a company that capitalizes its own software, EBITDA looks higher than for a peer that expenses it.
Industry structure distorts comparison. A lease-heavy retailer can show a low EBITDA margin while an asset-owning competitor shows a high one, even if the two run nearly identical shops. Debt-heavy asset owners and debt-free operators of the same leased estate can look nothing alike on EBITDA and behave very similarly.
Leases, taxes and working capital are all outside. Modern leases are recorded on the balance sheet rather than run through depreciation, which pushes rent back into EBITDA and inflates it. Cash taxes can be far above or below the book tax charge. Growth consumes working capital before it produces any of it.
The academic critique runs along the same line: economic value added, which charges management for the capital it employs, was designed specifically to do what EBITDA refuses to do. The signal that concerns me most, though, is behavioral. A company that never reported EBITDA and suddenly starts publishing it in a press release is usually doing it because management compensation or a valuation story depends on the number looking better.
How Can Investors Use EBITDA in Practice?
A five-step process will take an EBITDA figure from interesting to useful, and it runs in about ten minutes against a filing.
- Reconcile it. Start from the reported net income and rebuild EBITDA yourself, line by line. If you cannot get close to the company’s number, you have learned something important.
- Convert it to a margin. EBITDA divided by revenue, then compare with three or four sector peers. The gap matters more than the level.
- Bridge it to cash. Compare EBITDA with operating cash flow over three to five years. Persistent divergence in either direction is a question, not a footnote.
- Check the debt behind it. Look at net debt against EBITDA and EBITDA against interest expense. High leverage makes an otherwise decent margin dangerous.
- Read the adjustments. Find the adjusted figure, count the add-backs, and ask which of them would really stop next year.
The checklist version, if you are evaluating a share or a private business:
- EBITDA margin versus sector peers, and versus the company’s own history
- Three to five years of trend, not a single year
- Capital expenditure as a percentage of EBITDA, especially in mining, manufacturing and infrastructure
- Free cash flow conversion, and working capital movement
- Net debt to EBITDA, and EBITDA to interest coverage
- Capital expenditure required to sustain current output, not to expand it
- Leases and other obligations that EBITDA leaves out
- The EV/EBITDA multiple, and whether a peer group supports it
- Every add-back in the adjusted figure, judged on whether it recurs
On multiples specifically, a low EV/EBITDA reading is not automatically a bargain. It can mean the market expects the earnings to fall, that the business consumes more capital than the EBITDA suggests, or that the reported figure has been flattered. The multiple is the point where you apply judgment, not where you stop.
Frequently Asked Questions
No. EBITDA is an accounting measure of operating profit before financing, taxes, depreciation and amortization. Free cash flow is what remains after paying for assets, taxes and working capital. In the worked example here, EBITDA of 24.5 million became 6.6 million of free cash flow. Treating EBITDA as cash is the most common mistake beginners make with the metric.
Because the buyer changes the company’s capital structure on day one. An acquirer typically refinances existing debt with new, larger debt, which wipes out the target’s interest expense and tax position. Valuing on EBITDA keeps the price attached to operations rather than to how the seller happened to finance them, which makes two otherwise identical businesses comparable on the same page.
Not always. Capital-intensive sectors such as utilities, pipelines and mining naturally show high margins because their depreciation sits below the line, and much of the cash is spent replacing assets. Compare the margin against peers in the same sector, check the trend over several years, and look at what happened to the cash before drawing a conclusion.
Use it as a starting point and never as the headline. Adjusted figures add back restructuring charges, impairments, legal costs and stock-based compensation, and the company decides which items qualify. Some add-backs are genuinely one-off and some recur indefinitely. Build your own figure from the reported statements and compare it with management’s number before accepting either.
EBITDA starts from an accounting profit and adds back non-cash charges. Operating cash flow starts from that profit and keeps the non-cash charges out, then subtracts the movement in working capital such as receivables, payables and inventory. Operating cash flow is the harder number to manipulate, because cash either moved into the account or it did not.
Conclusion
EBITDA answers one question well: how profitable are the operations before financing, tax and accounting choices get involved. That is why private equity buyers, lenders, analysts and individual investors all reach for it, and why it sits at the centre of the EV/EBITDA multiple.
It does not answer how much cash the business produced, what the assets cost to sustain, or how much debt sits above the operations. Look at the trend over several years first, then the margin against sector peers, then every add-back in the adjusted figure, then the bridge from EBITDA to operating cash flow and free cash flow, and finally the debt load and its coverage.
Benchmarks, tax treatment and reporting rules vary by country and by sector and change over time, so treat the ranges here as starting points. Nothing in this guide is individual investment advice, and no multiple or margin promises a return.
Source: https://www.pgm-blog.com/what-is-ebitda-and-why-investors-use-it/
Anyone can join.
Anyone can contribute.
Anyone can become informed about their world.
"United We Stand" Click Here To Create Your Personal Citizen Journalist Account Today, Be Sure To Invite Your Friends.
Before It’s News® is a community of individuals who report on what’s going on around them, from all around the world. Anyone can join. Anyone can contribute. Anyone can become informed about their world. "United We Stand" Click Here To Create Your Personal Citizen Journalist Account Today, Be Sure To Invite Your Friends.
LION'S MANE PRODUCT
Try Our Lion’s Mane WHOLE MIND Nootropic Blend 60 Capsules
Mushrooms are having a moment. One fabulous fungus in particular, lion’s mane, may help improve memory, depression and anxiety symptoms. They are also an excellent source of nutrients that show promise as a therapy for dementia, and other neurodegenerative diseases. If you’re living with anxiety or depression, you may be curious about all the therapy options out there — including the natural ones.Our Lion’s Mane WHOLE MIND Nootropic Blend has been formulated to utilize the potency of Lion’s mane but also include the benefits of four other Highly Beneficial Mushrooms. Synergistically, they work together to Build your health through improving cognitive function and immunity regardless of your age. Our Nootropic not only improves your Cognitive Function and Activates your Immune System, but it benefits growth of Essential Gut Flora, further enhancing your Vitality.

Our Formula includes: Lion’s Mane Mushrooms which Increase Brain Power through nerve growth, lessen anxiety, reduce depression, and improve concentration. Its an excellent adaptogen, promotes sleep and improves immunity. Shiitake Mushrooms which Fight cancer cells and infectious disease, boost the immune system, promotes brain function, and serves as a source of B vitamins. Maitake Mushrooms which regulate blood sugar levels of diabetics, reduce hypertension and boosts the immune system. Reishi Mushrooms which Fight inflammation, liver disease, fatigue, tumor growth and cancer. They Improve skin disorders and soothes digestive problems, stomach ulcers and leaky gut syndrome. Chaga Mushrooms which have anti-aging effects, boost immune function, improve stamina and athletic performance, even act as a natural aphrodisiac, fighting diabetes and improving liver function. Try Our Lion’s Mane WHOLE MIND Nootropic Blend 60 Capsules Today. Be 100% Satisfied or Receive a Full Money Back Guarantee. Order Yours Today by Following This Link.


| Visits: | 1,834,001,127 |
| Stories: | 8,715,728 |
Whistler Blowers, Insiders

